Why Your Cell Counting Results May Be Inaccurate
– Understanding Cell Counting as a System of Errors
Introduction: Why Are Cell Counting Results Inconsistent?
Cell counting is one of the most fundamental and frequently performed tasks in life science research. From cell culture and drug treatment to toxicity testing, immunoassays, and cell therapy development, nearly all experiments begin with an “accurate cell count.” In this sense, cell counting results are not just simple numbers, but critical data that directly influence the quality and interpretation of downstream experiments.
However, in practice, it is not uncommon to observe discrepancies in results between different operators using the same sample, or inconsistencies even when repeated measurements are performed with the same instrument. Significant differences are also frequently observed between manual counting and automated cell counters. While these variations are often attributed to “user skill” or “instrument performance,” the reality is that they arise from far more complex and multifactorial causes.
Although cell counting may appear to be a straightforward process, it actually involves a combination of factors, including physical structures (chambers), statistical properties (sampling and distribution), biological variables (cell condition), chemical factors (staining), and software algorithms. If any one of these components is not properly understood or controlled, the results can easily become distorted.
In particular, with the increasing adoption of automated cell counters, there is a growing perception that “using a machine guarantees accuracy.” In reality, however, variations can still arise due to differences in algorithms, optical performance, and image processing methods between instruments. In other words, automation does not necessarily equate to standardization. In fact, relying on results without understanding the underlying mechanisms can lead to even greater errors.
Therefore, improving the accuracy of cell counting requires more than simply selecting the right instrument or following a protocol. It requires a structured understanding of the various factors that influence the results. In this article, we categorize the major sources of inaccuracy in cell counting into five key areas and systematically explain how each factor impacts the final outcome.
A. Counting Chamber: A Fundamental but Often Overlooked Variable
The most fundamental component in cell counting is the counting chamber.
For glass hemocytometers, the chamber height is generally considered to be 100 μm; however, in practice, slight variations may exist depending on the manufacturer and product.
Disposable counting chambers are typically produced through plastic injection molding, which introduces the possibility of shrinkage or deformation during manufacturing. In addition, maintaining a perfectly uniform chamber height during the bonding process of the top and bottom plates is technically challenging, leading to variability between products.
For this reason, in experiments where quantitative accuracy is critical, it is essential to verify the manufacturer’s COA (Certificate of Analysis).
B. Counting Volume: Statistical Limitations of Sampling
The accuracy of cell counting depends not only on instrument performance but also heavily on the actual observed sample volume.
As the observed volume increases, statistical variability decreases, and measurements based on multiple fields improve reproducibility. Conversely, when the observed volume is limited, variability in measurement results inevitably increases—even for the same sample.
This reflects a fundamental limitation: cell counting is inherently a sampling-based measurement process.
C. Sample Concentration: Measurement Limitations Across Concentration Ranges
In cell counting, different types of measurement errors arise structurally depending on cell concentration. In practice, the dominant error mechanisms vary across concentration ranges, which is a major source of variability in the results.
In low-concentration regions, the number of observable cells is limited, leading to increased statistical variability. This can be explained by Poisson distribution–driven sampling error, resulting in greater variation between replicate measurements.
In contrast, at high concentrations, reduced intercellular spacing leads to overlap, aggregation, and object merging. As a result, individual cells become difficult to distinguish, leading to undercounting. In addition, imaging-based systems may exhibit signal saturation, resulting in plateau effects beyond a certain concentration.
Thus, concentration-dependent errors arise from fundamentally different mechanisms: statistical limitations at low concentrations and detection limitations at high concentrations.
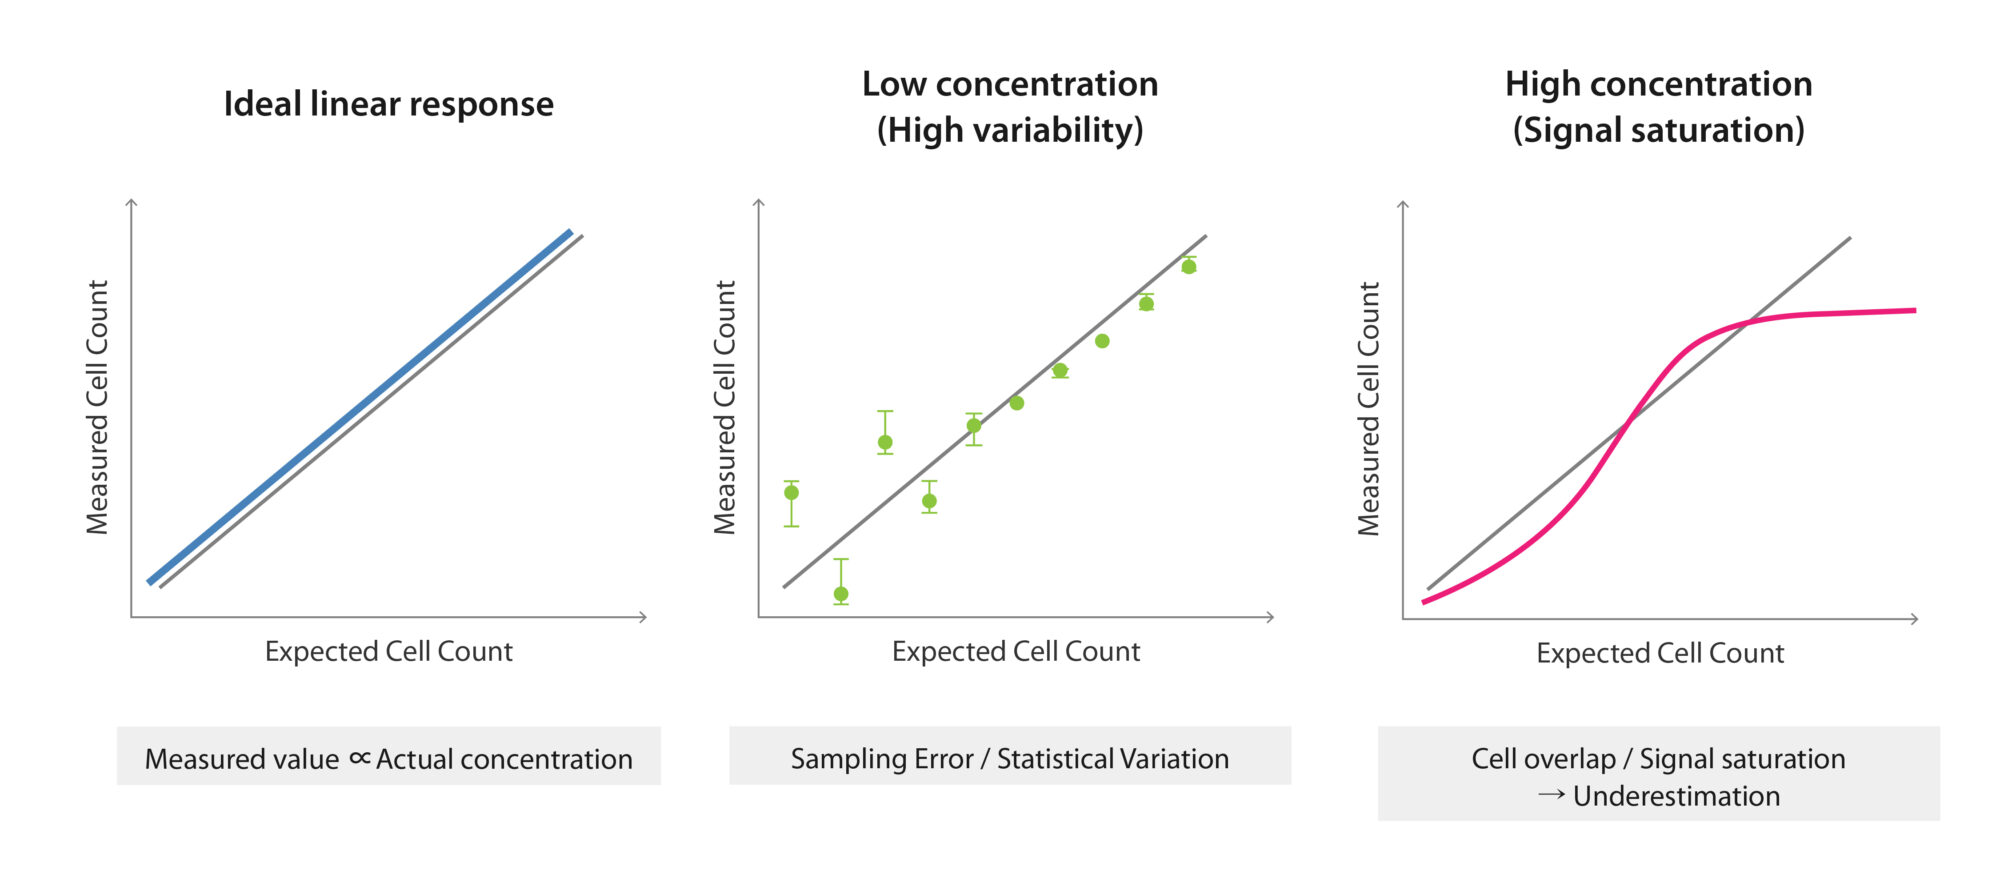
Figure 1. Distinct biological endpoints measured by cell viability stains
While measurement results are expected to follow a consistent trend with increasing cell concentration, different types of errors arise across concentration ranges under real experimental conditions.
In low-concentration regions, the limited number of observable cells increases statistical variability, leading to greater variation between replicate measurements.
In high-concentration regions, overlap and aggregation between cells, along with detection limitations in imaging systems (e.g., signal saturation), make it difficult to distinguish individual cells, potentially resulting in undercounting.
D. Sample Condition: The Most Influential Variable in Practice
In real experimental settings, the factor that most strongly impacts results is the condition of the sample itself.
Cells are not ideal single particles; rather, they are heterogeneous entities with varying sizes, morphologies, and biological states. Because of this complexity, counting results can vary significantly depending on sample condition.
Key variables include aggregation, debris, variability in cell size and shape, and the degree of mixing. When cells exist as clumps, multiple cells may be recognized as a single object, leading to undercounting. Conversely, in samples with substantial debris, non-cellular particles may be misidentified as cells, resulting in overcounting. In addition, insufficient mixing can cause concentration gradients within the same sample, leading to variability depending on the sampling location.
These effects become particularly pronounced under low-concentration conditions, ultimately reducing reproducibility.
In conclusion, cell counting results can be more strongly influenced by sample condition than by concentration alone.
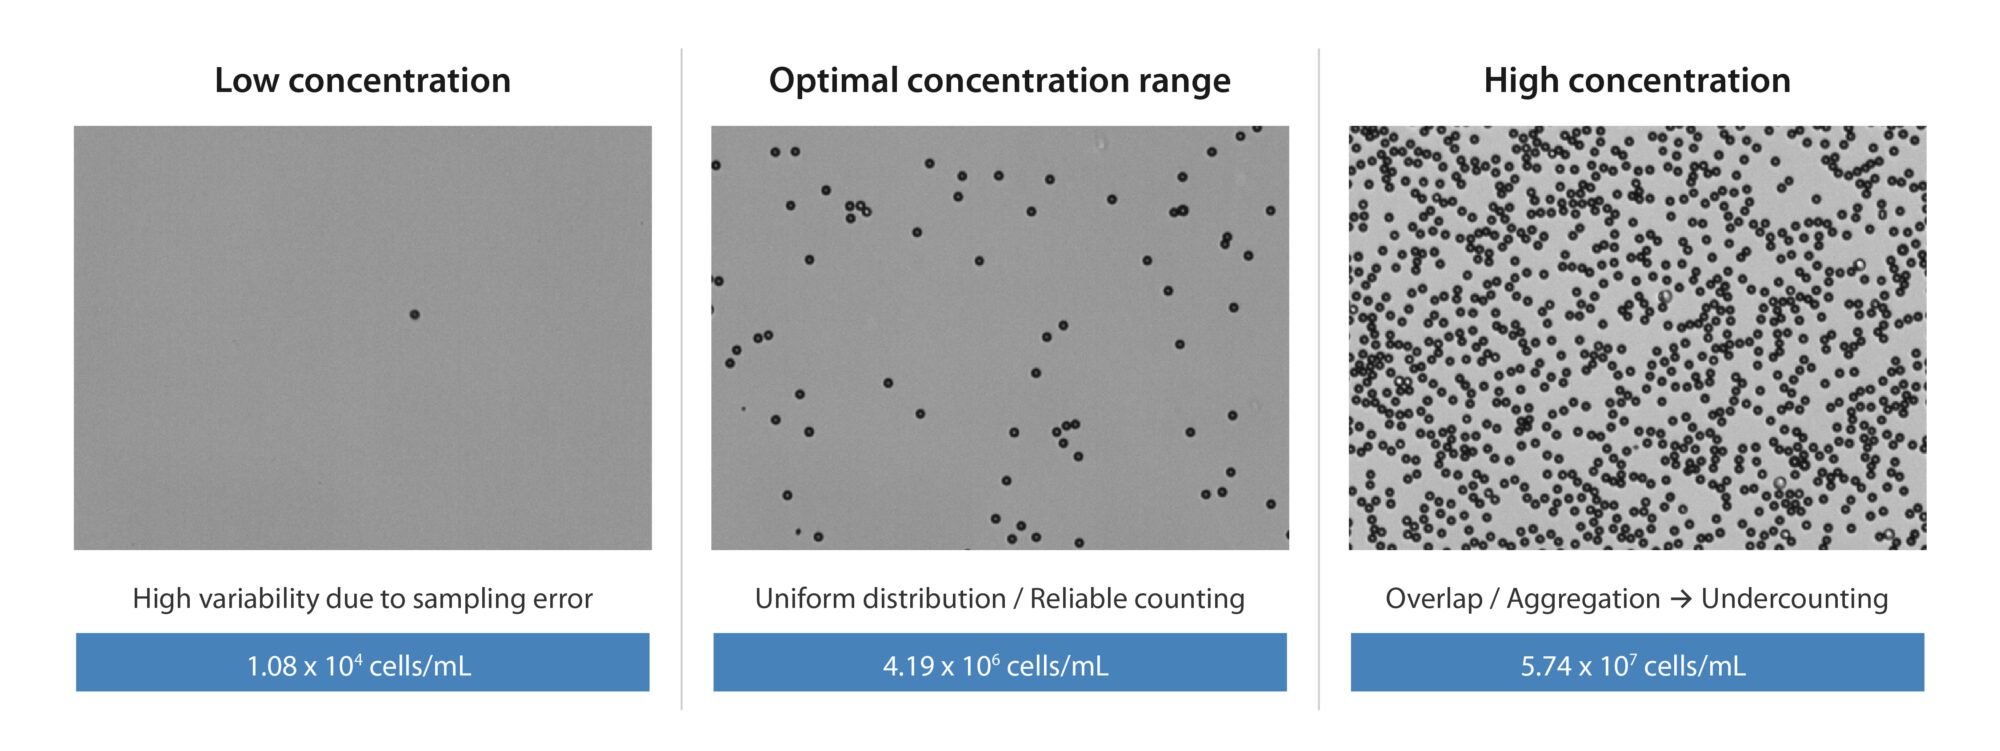
Figure 2. Changes in Cell Distribution and Counting Environment Depending on Sample Condition
At low concentrations, the limited number of cells within the field of view increases sampling variability. At high concentrations, overlap and aggregation make it difficult to distinguish individual cells. In contrast, within an optimal concentration range, cells are more uniformly distributed, enabling more reliable counting.
E. Measurement System: The Hidden Source of Error
In automated cell counting systems, users typically only see the final output, making it easy to overlook the multiple variables involved in the measurement process.
In reality, errors can arise at every stage—from sample loading to final result generation—and these errors do not act independently but accumulate throughout the workflow.
1) Chamber and Physical Structure
Variations in chamber height, non-uniform sample loading, capillary flow differences, and edge effects can all create density variations across fields, even within the same sample. These variations contribute directly to differences between replicates.
2) Staining
Staining is not merely a visualization step; it defines what is being measured. Different staining methods target different biological endpoints (e.g., membrane integrity, enzymatic activity), which directly influences result interpretation.
Additionally, factors such as staining time, dye toxicity, and incubation conditions can introduce measurement bias.
3) Imaging
Imaging parameters—such as focus, illumination, exposure, and resolution—affect cell boundary clarity and signal quality. Especially at high concentrations, even small changes in imaging conditions can significantly impact results.
4) Algorithm
Image analysis algorithms—including thresholding, size gating, segmentation, and declustering—can yield different results from the same image. In particular, how clumps and debris are handled is a major determinant of undercounting or overcounting.
Accumulation of Errors
Small deviations introduced at each stage can be amplified through downstream processes and ultimately reflected in the final result. Therefore, cell counting error should not be attributed to a single cause, but rather understood as the cumulative outcome of multiple interacting variables. This characteristic is consistent with the concept of measurement uncertainty defined in ISO 20391, where variability at each stage is integrated into the overall uncertainty of the final result.
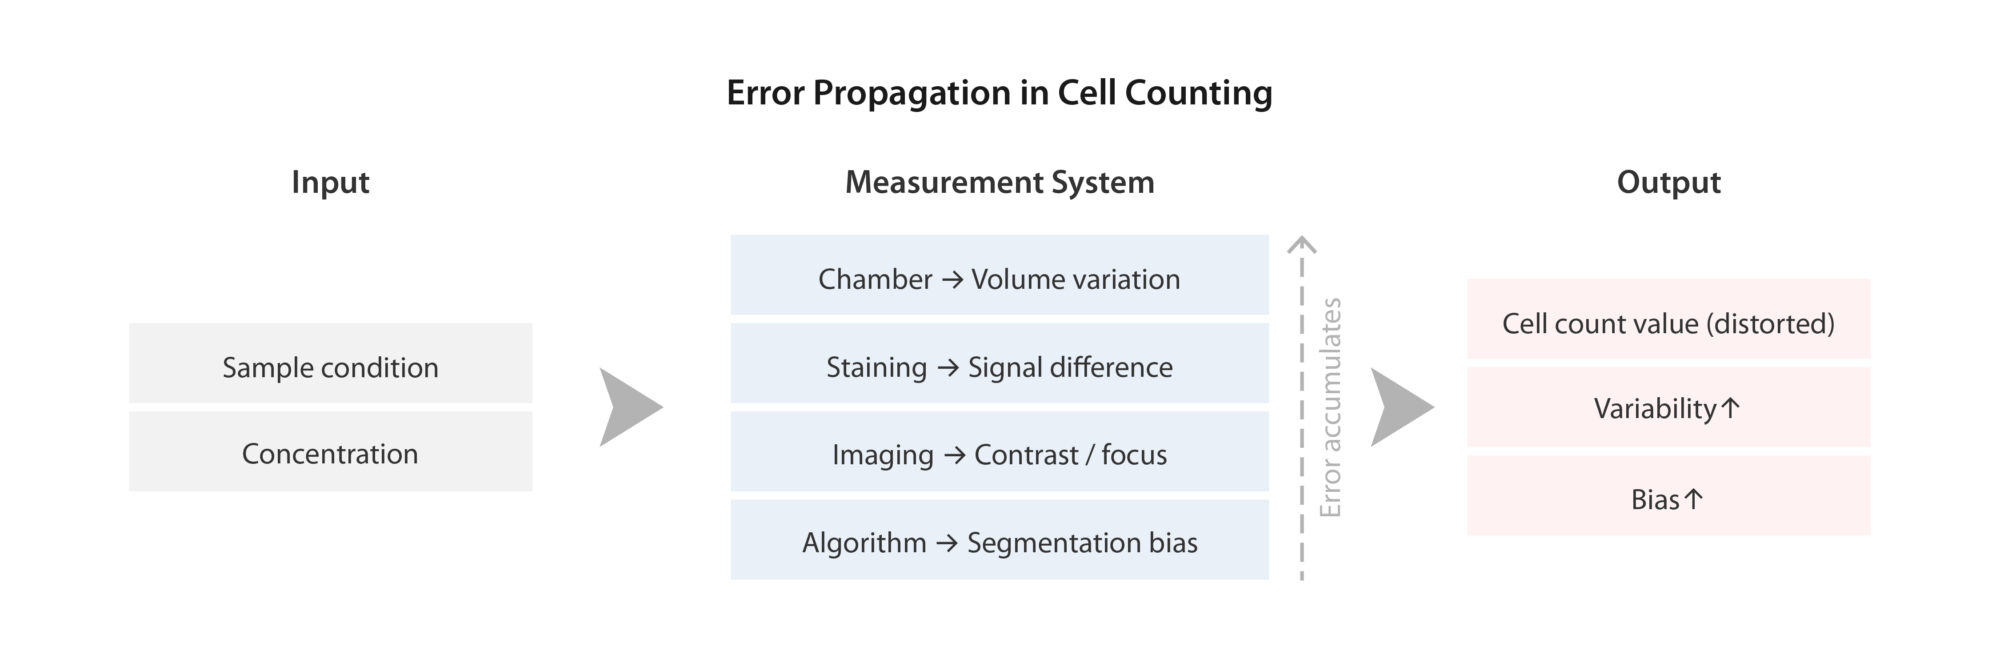
Figure 3. Sources and Accumulation of Errors in Cell Counting
Cell counting results are influenced by input variables such as sample condition and cell concentration, as well as by the measurement system, including chamber, staining, imaging, and algorithm.
At each stage, distinct types of error are introduced:
(1) sampling error (e.g., volume variation),
(2) detection error (e.g., staining and imaging differences), and
(3) analysis error (e.g., segmentation bias).
These errors do not act independently; instead, they accumulate and propagate throughout the measurement process, ultimately leading to increased variability and systematic bias in the final cell count.
Integrated Perspective: Cell Counting as a “System Output”
The factors discussed above do not exist in isolation. In actual measurements, they act simultaneously and are integrated into a single result.
Cell concentration, sample condition, staining method, instrument settings, and analysis algorithms all contribute to the final cell count. A change in any one of these components can alter the outcome.
Therefore, cell counting should be understood not as a simple measurement, but as the output of a complex measurement system.
Conclusion: Practical Approaches to Improving Cell Counting Accuracy
Improving the accuracy of cell counting cannot be achieved by optimizing a single factor alone. As discussed above, the final result is not determined by one variable, but rather by a combination of factors—including sampling, sample condition, and the measurement system—acting together as an integrated system.
To obtain reliable cell counting results in experimental settings, the following approaches are essential:
First, statistical variability should be minimized by securing a sufficient observation volume and performing replicate measurements. Second, sample conditions—such as cell aggregation, debris, and mixing state—should be standardized to reduce variability between measurements. Third, the measurement system—comprising the chamber, staining, imaging, and algorithm—should be maintained under consistent conditions, and potential sources of bias at each step should be clearly understood. Fourth, it is important to understand the underlying operating principles and analysis methods of the instrument being used, particularly segmentation and gating criteria, and to keep these conditions fixed.
Ultimately, what matters is not a single “accurate” value under a specific condition, but the ability to establish a measurement system that produces consistent results under the same conditions.
When such an approach is implemented, cell counting data becomes more than just numerical output—it serves as a reliable foundation for experimental data.
Logos Biosystems provides cell analysis and imaging solutions for a wide range of life science research applications.