Confluency is best described as the percentage of surface area covered by adherent cells in a culture medium. In cell culture biology, confluency assessment is important for visually determining the timing to proceed with cell-based experiments such as cell passage, harvest, transfection, or drug treatment. This is important because properly timing experiments is critical for maintaining cell quality and integrity. Generally, researchers directly view and judge cell confluency with the use of a standard microscope. However, using the CELENA® X High Content Imaging System and its laser auto-focusing modules, images can be rapidly and conveniently captured. The integrated CELENA® X Cell Analyzer software provides accurate data for quantitative analysis of cell confluency. Here, we describe how to take brightfield cell images and analyze confluency using the CELENA® X High Content Imaging System.
APPLICATION
For the confluency experiment, we used the McCoy cell line. McCoy cells were counted with the LUNA-II™ Automated Cell Counter, and seed to 2 x 10⁴ cells/ml in 96well plate. Cells were prepared in four replicates and placed in the CELENA® X Stage Top Incubator Pro with 95% humidity and 5% CO2 at 37℃. Cells were photographed automatically at 20-minute intervals for 48 hours with the CELENA® X High Content Imaging System using 10X LWD high NA objective and image-based autofocusing. Acquired images were analyzed using CELENA® X Cell Analyzer software. The method of analyzing cell confluency using CELENA® X Cell Analyzer was to identify overall cells based on the brightfield image of the cells; then measure the area occupied by these objects. A pipeline was created in CELENA® X Cell Analyzer to automatically batch process and analyze images (Table 1). To do this, the Enhance Edges module was used to create binary images that distinguished the foreground (the cells) from the background. The Smooth module was used to reduce intensity irregularities by homogenizing cells, smoothing edges, and removing debris from the background. The resulting segmented area was identified as cells using the Identify Primary Objects module and then measured using Measure Image Area Occupied module to quantify the surface area occupied by the cells within the field. The Overlay Outlines module was used to overlay the original brightfield images with the outlines of the segmentation precision. Figure 1 shows the segmentation of brightfield images for 48 hours. Image segmentation was obtained using the method described in Table 1 in CELENA® X Cell Analyzer. Cell images at 0, 16, 32, 48 hours were shown, and confluency was measured to be 17.1%, 47.0%, 62.4%, and 66.8%, respectively. The experiment was repeated with a total of 4 wells, and as time passed, it was confirmed that confluency increased.
Table 1. Daescription of the pipelines used to measure confluency with CELENA® X Cell Analyzer.

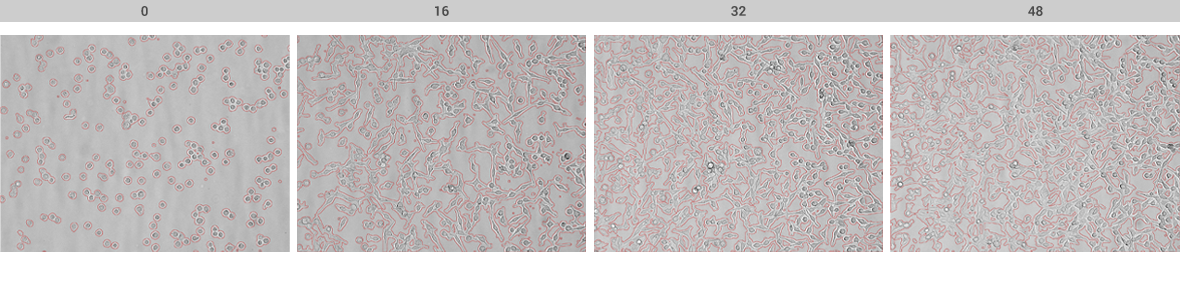
Figure 1. Image analysis of McCoy cells showing cell growth over time. Red borders illustrate the separation between background and the areas covered by intact cells.
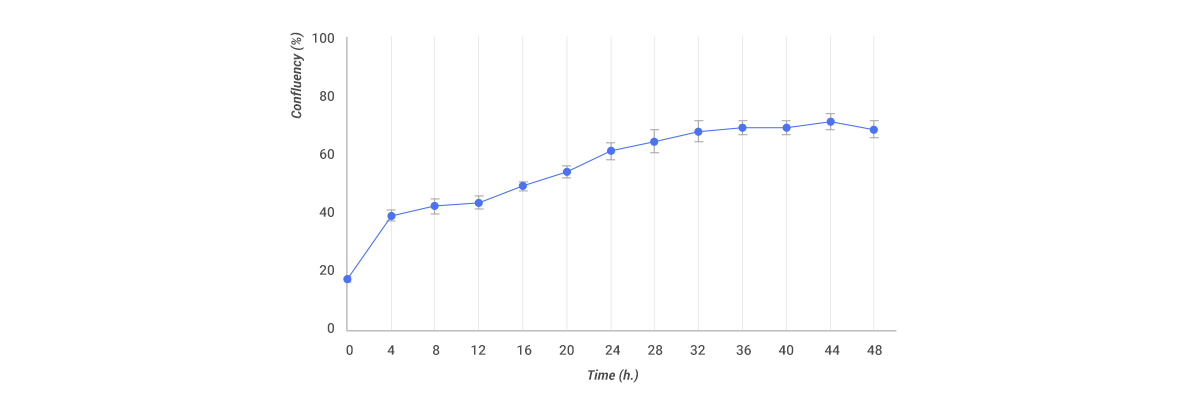
Figure 2. Curve of confluency change over time. The pictures were taken at 20-minute intervals for a total of 48 hours and were indicated by dots on the graph at 4 –hour intervals. N=4.
CONCLUSION
In this study, we used the CELENA® X High Content Imaging System to measure time-varying cell confluency. Live cell imaging combined with analysis of the cell surface area occupying each well is a reproducible and quantifiable approach for measuring confluency accurately and conveniently. CELENA® X Cell Analyzer software makes it possible to create pipelines, so that confluency can be simply and objectively quantified rather than subjectively judged. Since the CELENA® X High Content Imaging System and the CELENA® X Cell Analyzer software can be modified and applied to various experimental conditions and multi-well plates, it can be used as a high-throughput method for various cell-based assays.
4KB


