Key features
| High quality imaging and analysis of 3D cell models using the CELENA® X High Content Imaging System |
| Optimized pipelines for analyzing organoid and spheroid samples |
INTRODUCTION
Two-dimensional (2D) cell culture systems have been the standard for a wide variety of biological research because they are relatively inexpensive and easy to study. However, a growing body of evidence suggests that three-dimensional (3D) cell models can provide a more accurate representation of real cell environments than 2D cell culture systems. Organoids, for example, are organ-specific 3D cell models derived from human stem cells. They are designed to mimic the functionality and structure of human organs revealing the complex nature of that types of tissue. Moreover, 3D spheroids can represent a gradient of nutrients and oxygen between cells located in both outer and inner layers which is more relevant to physiological environments. Thanks to these advantages, 3D models are notably useful for studying various types of cancers. Here, we describe how organoid viability assays and spheroid growth assays can be imaged and analyzed using the CELENA® X High Content Imaging System and the CELENA® X Cell Analyzer software.
MATERIALS AND METHODS
Patient-derived colorectal cancer (CRC) organoid samples were obtained from Seoul Asan Medical Center. Organoid samples were treated with DMSO and different concentrations of Cisplatin (10, 20, and 40 µM). They were stained with Calcein AM (Life Technologies, C3099) and Ethidium Homodimer-1 (EthD-1; Life Technologies, E1169). Spheroid samples were prepared by plating HeLa cells on a 96-well, round bottom plate with densities of 0.5, 1, 5 X 10³ cells/well. Prepared samples were imaged over 14 days (Day 1, 4, 6, 7, 8, 11, 13, and 14). Acquired images were analyzed using CELENA® X Cell Analyzer software. Both organoid and spheroid samples were imaged using a 4X LWD high NA objective. An EGFP filter cube (Ex470/30, Em530/50), and a RFP filter cube (EX530/40, Em605/55) were used for multi-channel imaging.
ORGANOID VIABILITY ASSAY
The organoid viability assay is a useful tool for anticancer drug screening, but requires a different strategy of imaging and analysis compared to 2D cell culture. For example, organoids have multiple focal planes making it difficult to acquire in-focused images for multiple organoids. For live/dead cell viability of the single organoid, a different analysis strategy is required since individual cells in an organoid do not exist as a single live/dead status. To address this issue, we took an advantage focus merge software module of the CELENA® X High Content Imaging System after acquiring Z-stack images from multi-channel fluorescence. Cisplatin treated CRC organoid samples were imaged on 5 different focal planes. Images were then processed using the ‘MergeFocus’ module to merge 5 different focal planes (Figure 1).
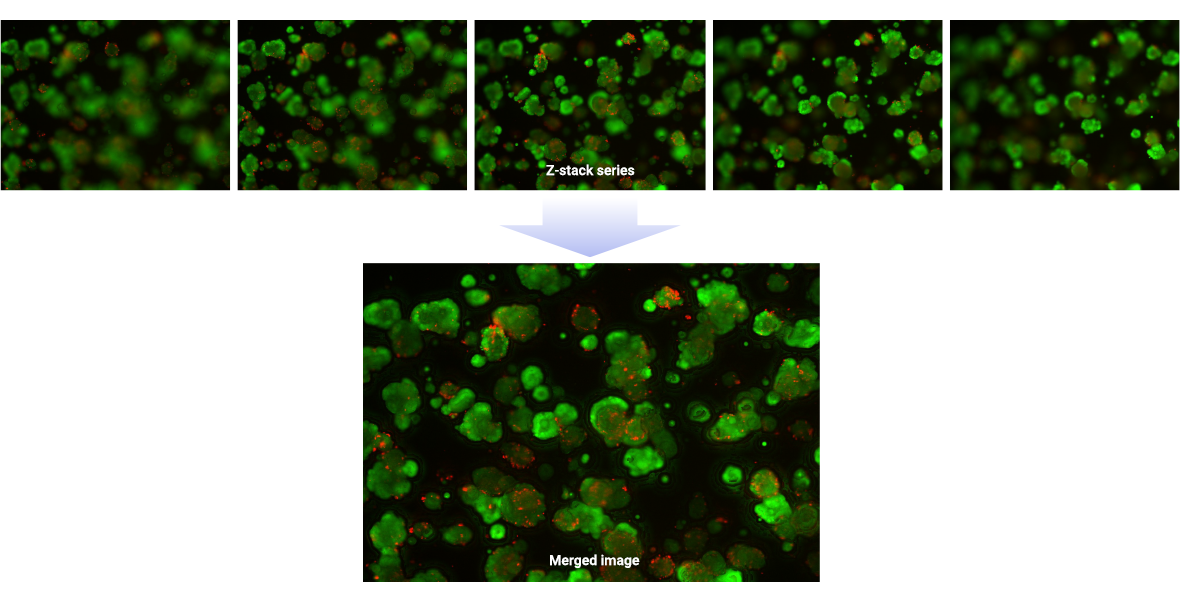
Figure 1. Images taken on 5 different focal planes were processed to create a merged image.
Merged images were then analyzed to evaluate viability of organoids. The strategy was to compare Calcein AM and EthD-1 signals from organoids. Calcein AM produces intense green fluorescent signal by esterase activities in live cells, while EthD-1 is a dead cell-specific red fluorescent dye. The viability of organoids was measured by comparing green and red fluorescent signals. Images obtained from GFP and RFP channels were overlayed using the ‘ImageMathOverlay’ module. Overlayed images were used to identify all objects expressing fluorescent signals with the ‘IdentifyPrimaryObjects’. Intensity and size of objects were quantified using the ‘MeasureObjectIntensity’ and ‘MeasureObjectSizeShape’ modules (Table 1).

Table 1. Description of the pipeline used to assess cell cycle with CELENA® X Cell Analyzer
Color composite images showing both green and red signals were made with the ‘GrayToColor’ module (Figure 2B). The analyzed data showed Calcein AM signal decreases while EthD-1 signal increases with the higher Cisplatin concentration (Figure 2, A and B).
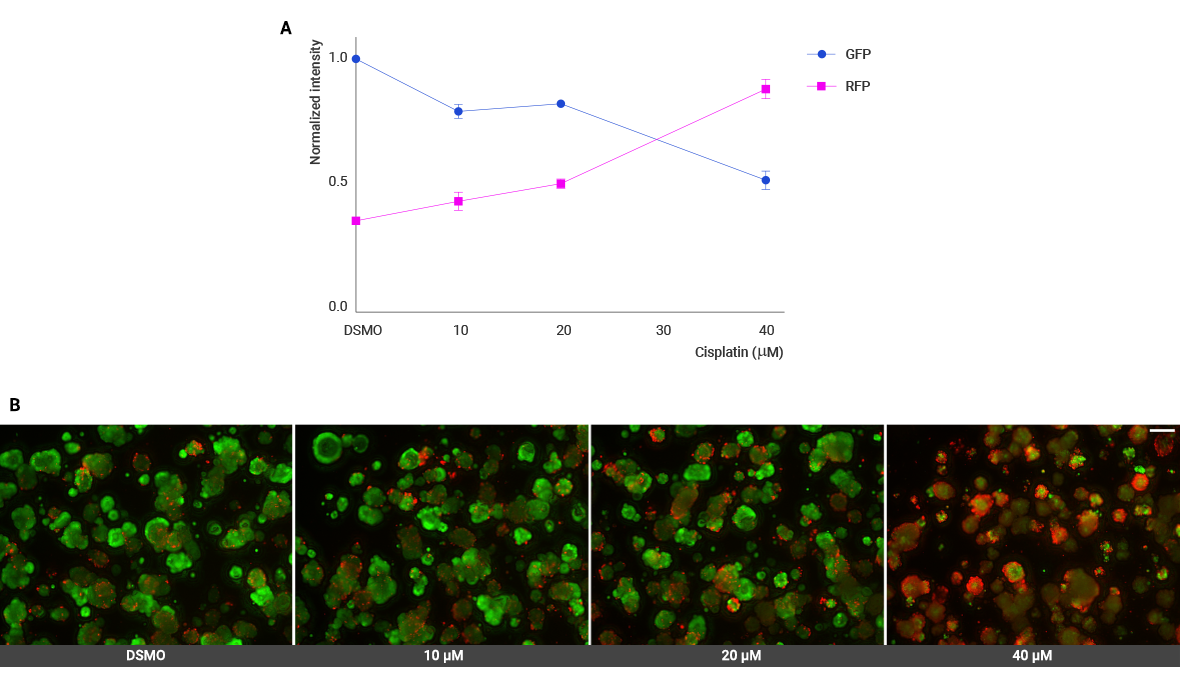
Figure 2. (A) The graph showing normalized intensity of GFP and RFP. (B) Images acquired using CELENA® X system showing change in green and red fluorescence (scale bar: 200 µm).
SPHEROID GROWH ASSAY
Spheroid growth according to the seeding density was assessed by measuring the area, major axis length, and perimeter of spheroid samples. The ‘EnhanceOrSuppressFeatures’ module was used to distinguish spheroid samples from the background. Bright and dark areas were inverted using the ‘Invert’ module. Spheroids were then identified using the ‘IdentifyPrimaryObjects’ module. The ‘MeasureObjectSizeShape’ module measured the size of identified objects selecting options including Area, MajorAxisLegnth, and Perimeter. Brightfield Images presenting the outlines around spheroids were produced using the ‘OverlayOutlines’ module (Figure 3A).

Table 2. Description of the pipeline used to assess spheroid growth with CELENA® X Cell Analyzer
The growth and morphology of HeLa cells were imaged for 14 days using the CELENA® X High Content Imaging System (Figure 3A). These images were used to measure the Area, MajorAxisLegnth, and Perimeter of spheroids. The growth curves showed that sizes vary according to different seeding densities of spheroids (Figure 3B).
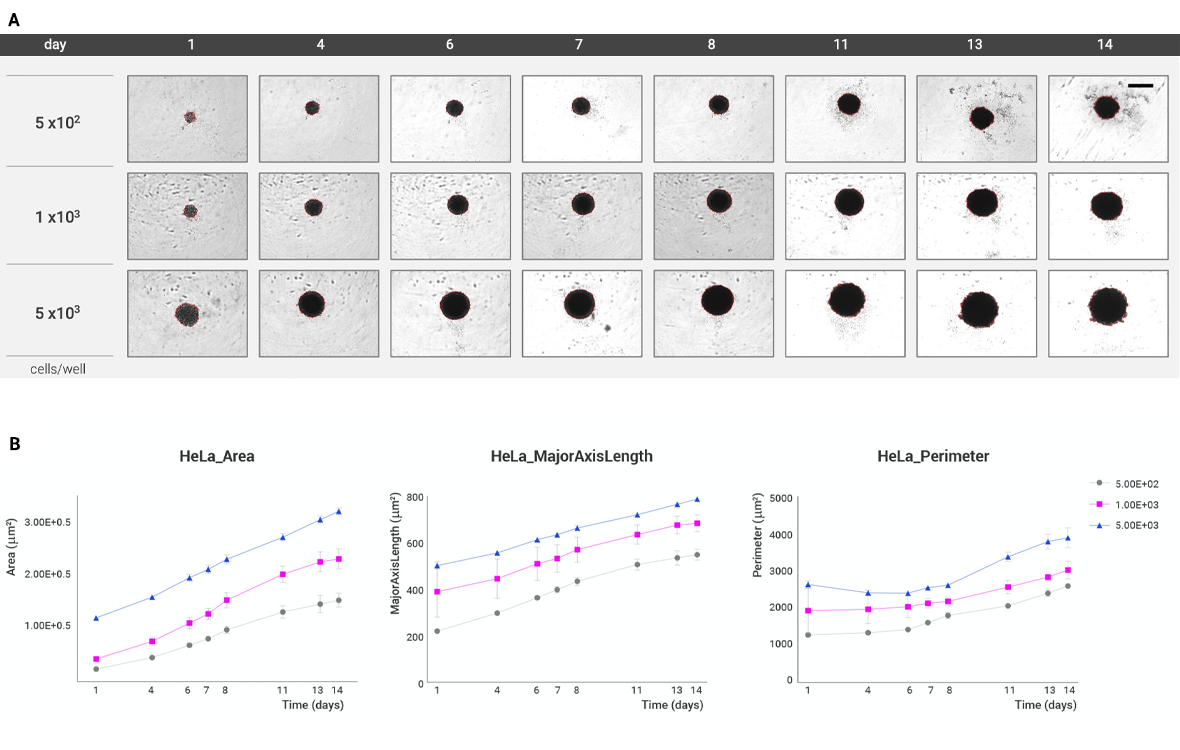
Figure 3. (A) The montage showing the growth of spheroids over time with different seeding densities (Scale bar: 500 µm). (B) The graphs showing the Area, MajorAxisLength, and Perimeter of spheroids. Spheroids have bigger sizes according to the seeding density.
CONCLUSION
In this study, we demonstrated how to analyze 3D cell models using CELENA® X High Content Imaging System. High content imaging combined with analysis for organoid viability and spheroid growth provided a reproducible and quantitative method to study 3D cell models. Furthermore, the ‘MergeFocus’ module was found to be a highly effective tool for analyzing Z-stack images of 3D cell models. In conclusion, the CELENA® X High Content Imaging System combined with the CELENA® X Cell Analyzer Software would be advantageous for 3D model imaging and analysis.
6KB


