Key features
| High throughput screening of apoptosis using the CELENA® X high content imaging system. |
| Optimized analysis pipeline to evaluate apoptosis. |
Apoptosis is a form of programmed cell death (PCD). It is a highly controlled cellular process that acts to eliminate unwanted and/or damaged cells during a cell’s early growth and development. There are two pathways, intrinsic and extrinsic, that induce apoptosis. Despite being distinct pathways both the intrinsic and the extrinsic pathway require activation of caspase 3 and caspase 7. As a result, monitoring caspase 3/7 activity is used as a proxy for monitoring apoptosis. Here, we demonstrate the ability of the CELENA® X High Content Imaging System to monitor and quantify apoptosis using the CellEvent™ Caspase-3/7 Green Detection Kit.
Cell preparation
RAW 264.7 cells were counted using the LUNA-II™ Automated Cell Counter and seeded at a density of 1 x 10⁴ cells/50µL/well in a half area 96-well plate overnight. Nuclei were counterstained with Hoechst 33342 (Life Technologies, H3570) for laser autofocusing. Cells were washed twice using the cell culture media to remove excess dye before imaging.
Imaging and analysis
Apoptosis was evaluated by measuring the increase in Caspase-3/7 activity over time after inducing using CellEvent™ Caspase-3/7 Green Detection Reagent (catalog number C10423; Life Technologies). The CellEvent reagent only becomes fluorescent when bound to DNA after cleavage by Caspase-3/7 which making it an ideal tool for monitoring apoptosis. Imaging and analysis were performed using the CELENA® X High Content Imaging System, CELENA® X Cell Analyzer software, and the CX Stage Top Incubator Pro [Tokai] (95 % humidity, 5 % CO2, and 37 ℃). Time lapse image acquisition was performed at T0 (time point) and then at 15-minute intervals for 2 hours. The cell culture media were exchanged with the fresh media containing 2 µM CellEvent™ Caspase-3/7 Green Detection Reagent and incubated for 30 minutes. Camptothecin was then added to cells with the final concentration of 0 µM and 2.5 µM to induce apoptosis. Live-cell imaging started immediately after adding Camptothecin. Images were captured using an Olympus 10X LWD high NA objective, a DAPI filter cube (Ex395/25, Em460/50) and an EGFP filter cube (Ex470/30, Em530/50). Quantifying apoptotic events was done by measuring the area occupied by green fluorescence (Caspase-3/7 activity) occupied and the area occupied by blue fluorescence (Nuclei). Objects containing green and blue fluorescence were identified using the ‘IdentifyPrimaryObjects’ module. The area of fluorescence was measured using the ‘MeasureImageAreaOccupied’ module (Table 1). To visualize the data, the ‘MaskImage’ module was used to eliminate areas of low signal The ‘GrayToColor’ module was used to convert the grayscale images to color images (Figure 1).
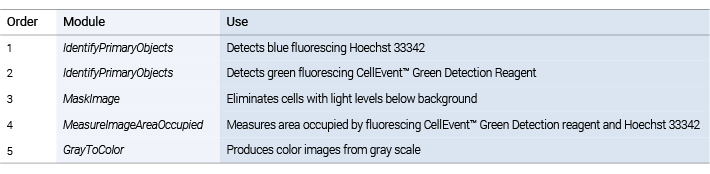
Table 1. Description of the pipeline used to assess apoptosis with CELENA® X Cell Analyzer
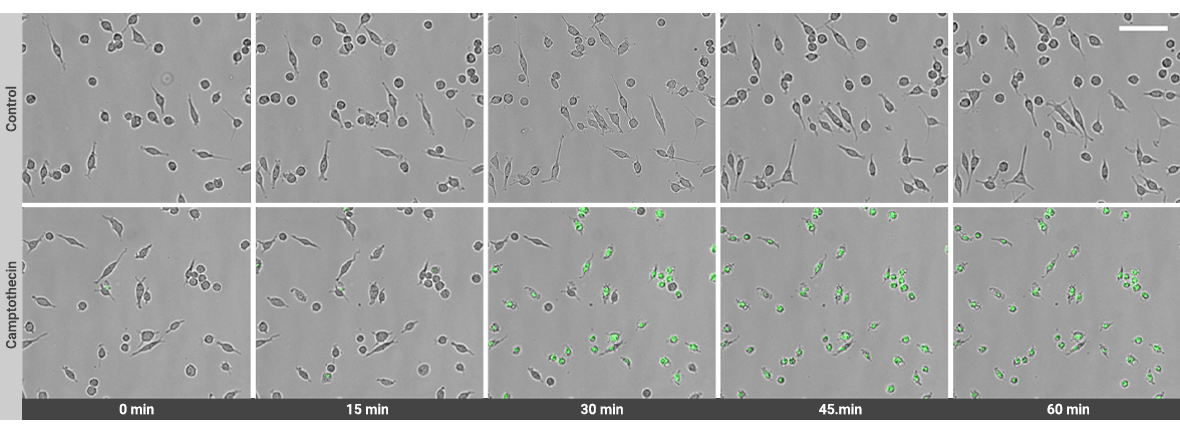
Figure 1. QTime-lapse images acquired using CELENA® X system showing green fluorescence increasing over time (scale bar: 100 µm)
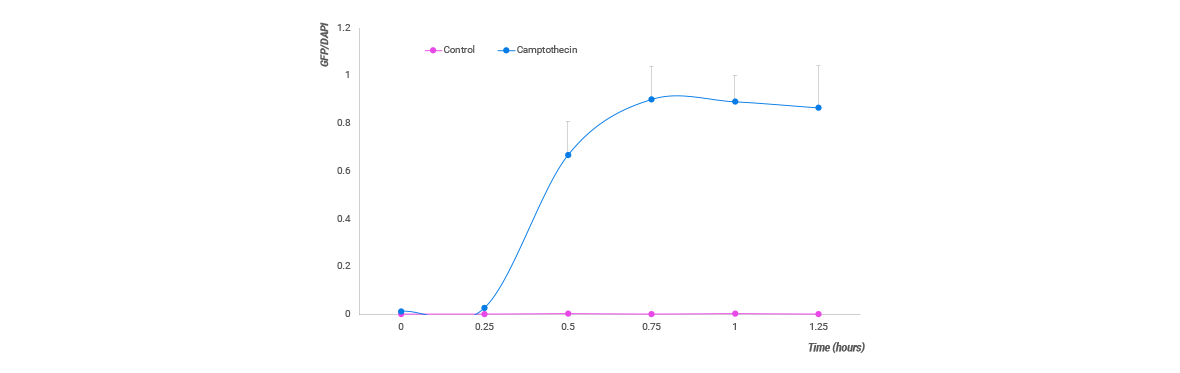
Figure 2. Quantification of apoptosis. The area occupied by green fluorescence (showing caspase activity) was divided by DAPI (showing Nuclei). Camptothecin treatment increases caspase activity over time.
In this study, we analyzed apoptotic events after Camptothecin treatment using the CELENA® X High Content Imaging System. Images were automatically taken and analyzed to identify objects, measure area, and produce images showing Caspase-3/7 activity. As shown in Figure 1 and 2, caspase activity was increased, and cells underwent apoptosis over time. Establishing the analysis pipeline was simple and straightforward. Overall, the CELENA® X High Content Imaging System, CELENA® X Cell Analyzer software, and CX Stage Top incubator proved to be an effective and efficient system for quantifying and monitoring apoptosis activity.
4KB


