Blog
|
Contact
International
EN
KR
FR
ES
CN
Blog
EN
KR
FR
ES
CN
Products
Cell Counting
Overview
Brightfield Cell Counters
LUNA-II™
Fluorescence Cell Counters
LUNA-FX7™
LUNA-FL™
LUNA-STEM™
Microbial Cell Counters
LUNA-II YF™
QUANTOM Tx™
Consumables & Accessories
Compare Cell Counters
Cell Imaging
CELENA® X
CELENA® S
Accessories
Tissue Clearing
Overview
Tissue Clearing
X-CLARITY™
Labeling & Imaging
DeepLabel™
Consumables & Accessories
OEM Products
Request a quote demo
Request a quote for the cell counter of your choice.
Learn More >
Customer Reviews
Customer Reviews
Photo Testimonials
Researcher Highlights
Citations
Request a quote demo
Request a quote for the cell counter of your choice.
Learn More >
Resources
Technical Documents
Application Notes
Technical Notes
White Papers / Posters
Brochures
User Guides
Videos / Webinars
Image Gallery
Request a quote demo
Request a quote for the cell counter of your choice.
Learn More >
Support
Requests & Inquiries
Quote/Demo Request
Tech Support/Service Request
Email Us
CoA & MSDS
CoA
MSDS
Software
Request a quote demo
Request a quote for the cell counter of your choice.
Learn More >
About Us
About Us
Contact Us
News
Events
Request a quote demo
Request a quote for the cell counter of your choice.
Learn More >
Shop / Buy
Products
< Back
Cell Counting
Overview
LUNA-II™
LUNA-FX7™
LUNA-FL™
LUNA-STEM™
LUNA-II YF™
QUANTOM Tx™
Consumables & Accessories
Compare Cell Counters
Cell Imaging
CELENA® X
CELENA® S
Accessories
Tissue Clearing
Overview
X-CLARITY™
DeepLabel™
Consumables & Accessories
OEM Products
Customer Reviews
< Back
Customer Reviews
Photo Testimonials
Researcher Highlight
Citations
Resources
< Back
Technical Documents
Application Notes
Technical Notes
White Papers / Posters
Brochures
User Guides
Videos / Webinars
Image Gallery
Support
< Back
Requests & Inquiries
Quote/Demo Request
Tech Support/Service Request
Email Us
CoA & MSDS
CoA
MSDS
Software
About Us
< Back
About Us
Contact Us
News
Events
Shop / Buy
Accurate counts and results
you can trust.
Cell counting will never be the same.
Explore Our Counters
Customer Reviews
See what real users have to say about the Logos Biosystems' family of products >
Application Notes
From academia to biomanufacturing, explore our extensive collection of application notes and whitepapers >
Blog
Exchange ideas, protocols, and experiences with your peers >
What’s New
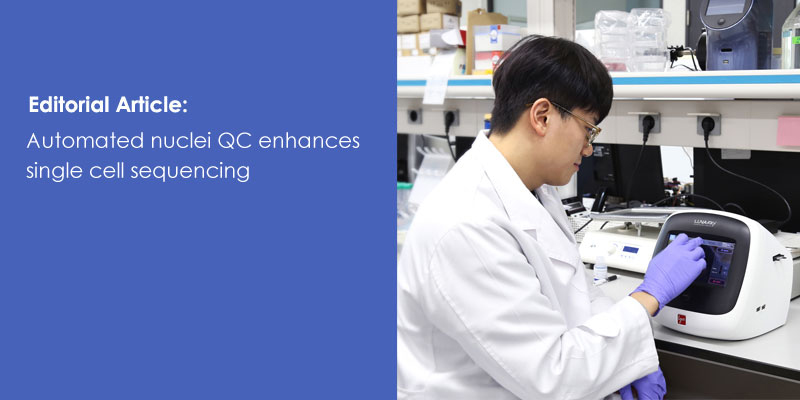
SelectScience releases editorial article
Learn More >
In the News
In the Events
2024-04-18
SelectScience® releases newest edition of popular ‘How-To-Buy’ eBook on cell counting technology.
2024-03-29
Logos Biosystems featured in the latest cell and gene therapy eBook released by Biocompare
2024-03-19
SelectScience Webinar: Optimizing Nuclei Quality Assessments with Automated Cell Counting
2024-02-07
SelectScience releases editorial article, “Automated nuclei QC enhances single cell sequencing, featuring the LUNA-FX7™ and LUNA-FL™
View All News >
Load More
View All Events >
Promotions
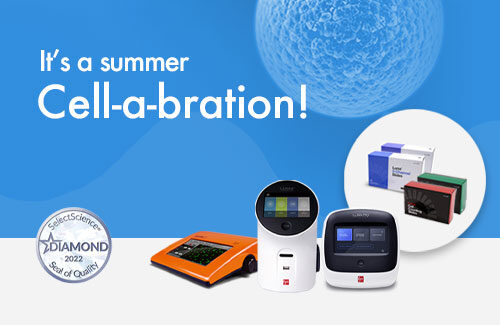
Free Slides
2023-07-01 ~ 2023-08-31
Cell-a-brate this summer with free slides.
Customer Loyalty Program
2022-06-01 ~
Current customer? Find out how you can receive free consumables for referrals.
2022-10-01 ~ 2022-12-31
Logos Biosystems announces the LUNA™ Love Photo Contest in celebration of its’ Diamond Seal of Quality award by SelectScience®
Show More >
Our Products
Request Quote/ Demo
Cell Counters
Cell Imaging
Tissue Clearing
LUNA-II
TM
Automated Cell Counter
Learn More
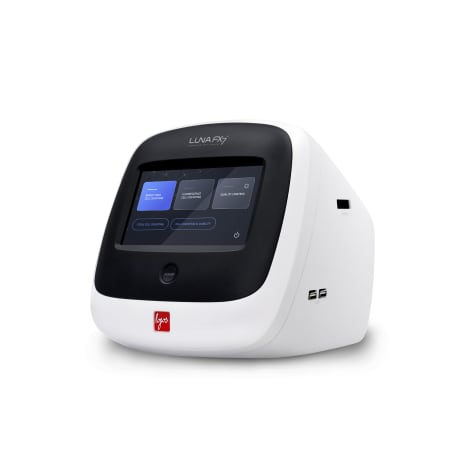
LUNA-FX7
TM
Automated Cell Counter
Learn More
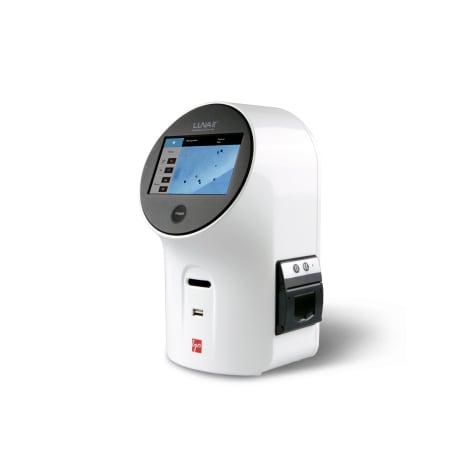
LUNA-FL
TM
Dual Fluorescence Cell Counter
Learn More
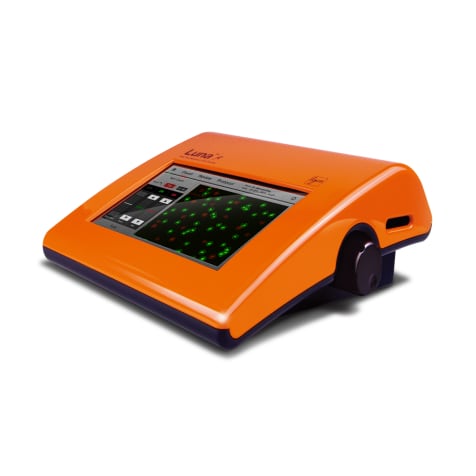
LUNA-STEM™
Automated Fluorescence
Learn More
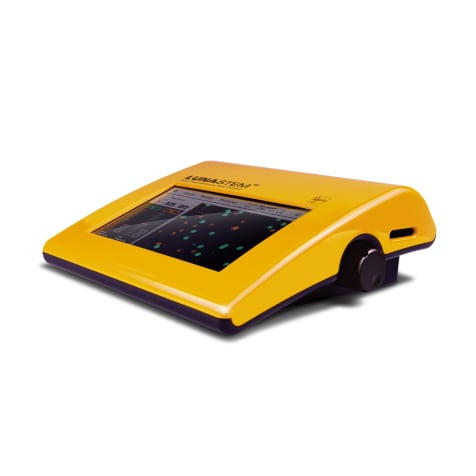
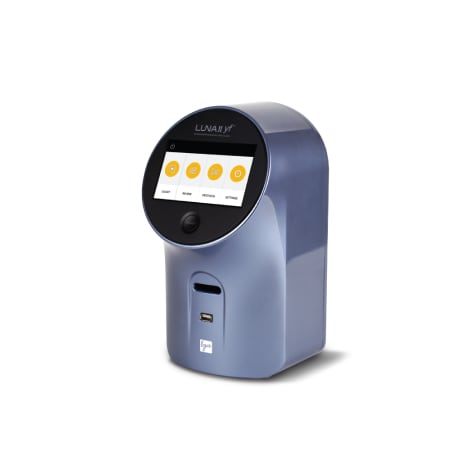
LUNA-II YF™
Automated Yeast
Learn More
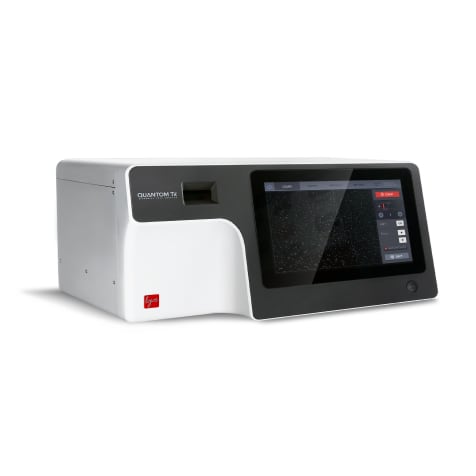
QUANTOM Tx
TM
Microbial Cell Counter
Learn More
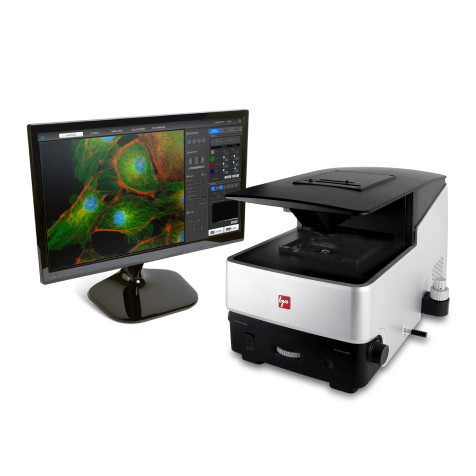
CELENA® X
Cell Imaging
Learn More
CELENA® S
Cell Imaging
Learn More
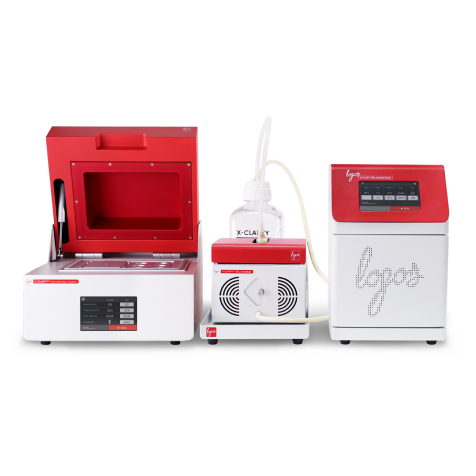
X-CLARITY™
Tissue Clearing
Learn More
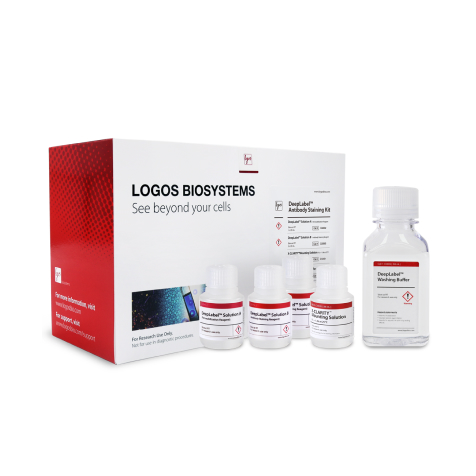
DeepLabel™
Tissue Clearing
Learn More
Support
Quotation/Demo
Request a quote/demo for the productof your choice.
CoA/MSDS
Access material safety data sheets and request certificates of analysis.
Technical Documents
Look through our product brochures, user guides, tech notes, and posters.
Software
Find software updates for your Logos product here.