Keywords
The accurate evaluation of nuclei quality is pivotal for single cell genomics research. Combining fluorescent dyes with imaging tools such as automated cell counters, provides an effective method to evaluate nuclei quality. With a myriad of fluorescent dyes available, choosing the optimal combination to assess nuclei quality is paramount to ensuring the reliability of results. Furthermore, given the advanced capabilities of modern automated cell counters like the LUNA-FX7™ and LUNA-FL™, there is an increasing necessity to understand how these systems perform when integrated with different fluorescent dyes. This study aims to identify the most effective dye combinations for nuclei quality assessment using different cell types, different systems, and nuclei fixation. Through our comprehensive analysis, we seek to offer insights that streamline and enhance the accuracy of nuclei assessment procedures in single cell genomics research settings.
Four different fluorescent dyes, each with distinct final concentrations, were utilized in the study: Acridine Orange (AO) at 28 µM, Calcein AM at 12.5 µM, Propidium Iodide (PI) at 15 µM, and Ethidium Homodimer-1 (EthD-1) at 20 µM. These dyes were incorporated into different dye combinations, including AO/PI, AO/EthD-1, Calcein AM/PI, and Calcein AM/EthD-1. Each combination was prepared by adding 1 µL of each dye to create a total of 2 µL, which was then mixed with 18 µL of the cell sample.
Experiments were conducted to identify optimal dye combinations for assessing the nuclei quality using different fluorescent dyes on U937 cells and 3T3 cells. Theoretically, an intact cell should be selectively stained only by membrane-permeable dyes like AO and Calcein AM. On the other hand, nuclei isolated after cell membrane removal should be stained by membrane-impermeable dyes such as PI and EthD-1, displaying viability similar to that of dead cells.
Among four different dye combitions, AO/PI, AO/EthD-1, Calcein AM/PI, and Calcein AM/EthD-1, the combination of AO with PI or AO with EthD-1 accurately displayed the viability of both intact cells and isolated nuclei (Figure 1A). The presence of green and red signals allowed for measuring viability in both U937 cells and 3T3 cells. However, we observed nearly no Calcein AM signal in 3T3 cells, while approximately two-thirds of U937 cells exhibited a Calcein AM signal (Figure 1B). This discrepancy can be attributed to Calcein AM’s reliance on esterase activity, which may vary among different cell types. Consequently, the use of Calcein AM resulted in the omission of certain intact cells, compromising the reliability of the viability assessment.
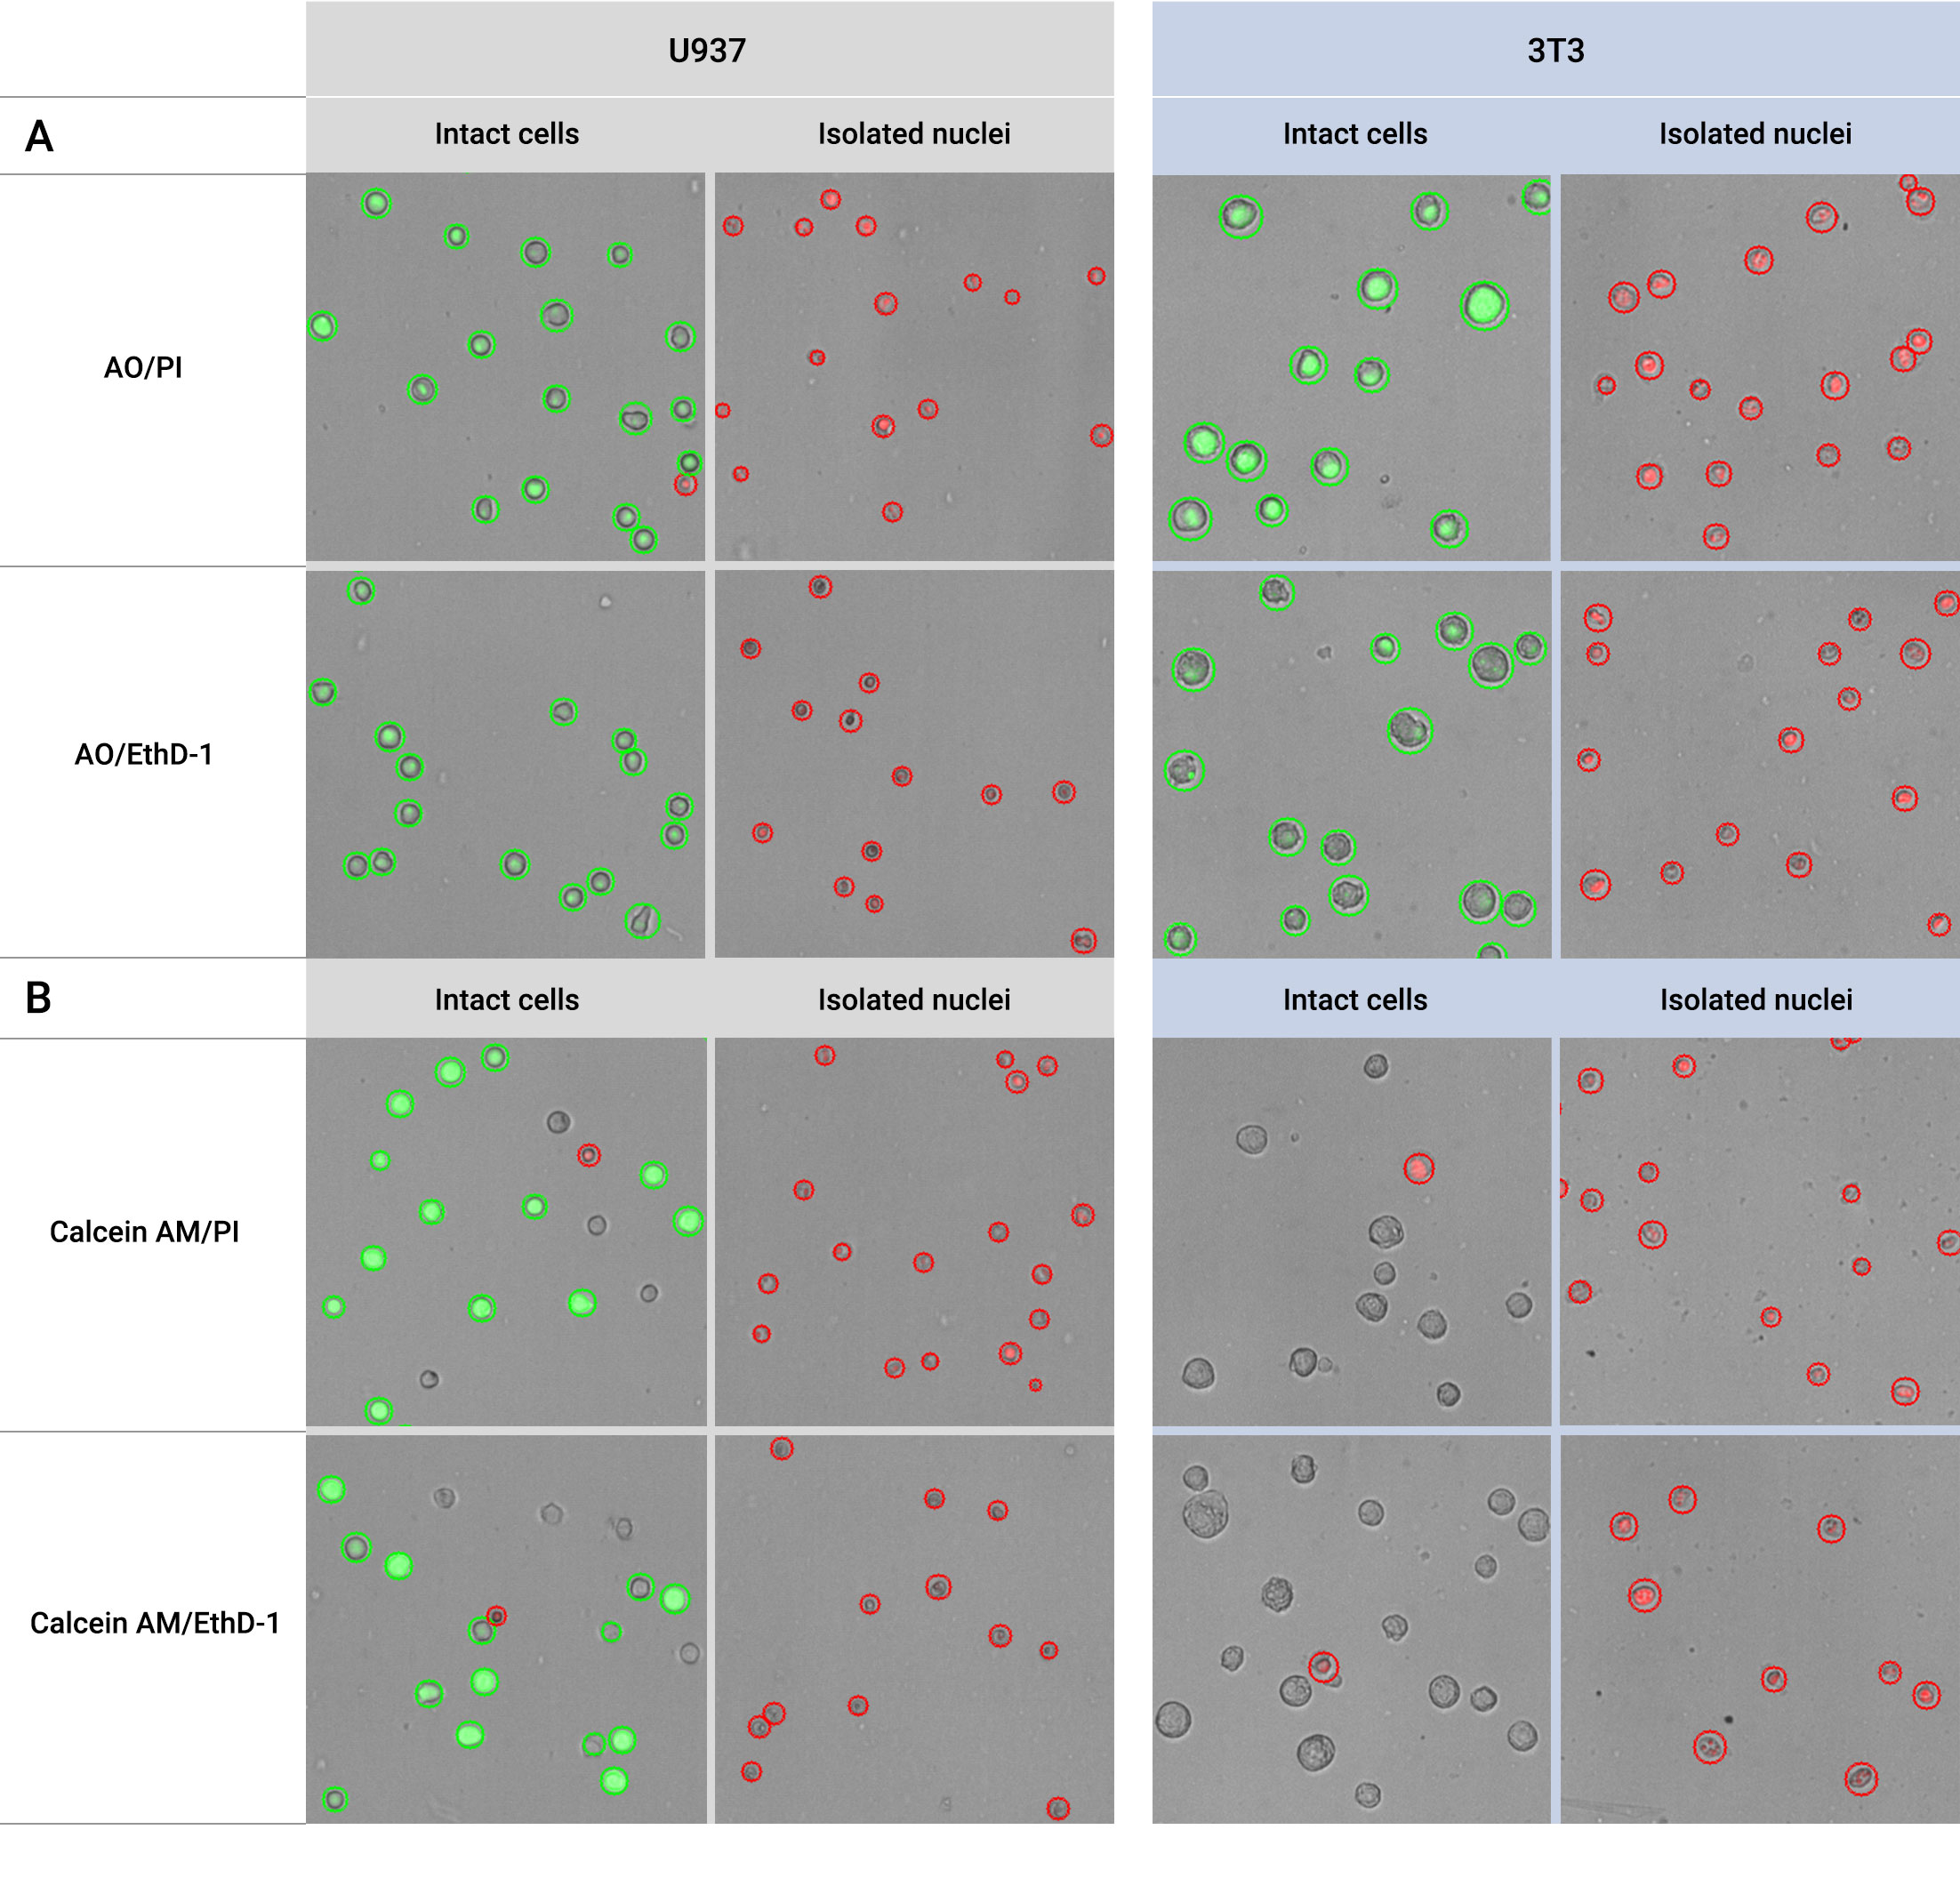
Figure 1: (A) Staining results of U937 cells and 3T3 cells using the combinations of AO with PI and AO with EthD-1. (B) Staining results of U937 cells and 3T3 cells using the combinations of Calcein AM with PI and Calcein AM with EthD-1.
The LUNA-FX7™ and LUNA-FL™ systems are advanced platforms with robust capabilities for comprehensive analysis. These systems seamlessly capture both brightfield and fluorescent images that are then analyzed to obtain valuable data such as size, viability, and cell count using fluorescent signals.
To evaluate the quality of isolated nuclei, one can utilize the average cell size data provided by these systems. For instance, nuclei from which the membrane has been removed are measured to be significantly smaller in size compared to intact cells. This is because the removal of the cell membrane and cytoplasm leads to a reduction in cell size by several micrometers. In particular, the LUNA-FL™ and LUNA-FX7™ extract cell size information from the brightfield image. As a result, there’s minimal distortion of cell size due to fluorescence intensity that might accompany calculations from fluorescent images. This ensures a more reliable cell size measurement when assessing the quality of isolated nuclei.
Another useful data for nuclei quality assessment is cell viability using the fluorescent dyes. As indicated in prior results in Figure 1, when combined with AO/PI or AO/EthD-1, healthy intact cells exhibit cell viability close to 100%. In contrast, well-separated nuclei display cell viability close to 0%. Notably, automated cell counters like LUNA-FL™ and LUNA-FX7™ enable accurate quantification of isolated nuclei cell concentration when stained with these dyes (Figure 2). These results provide valuable data, confirming the quality of nuclei for subsequent applications.
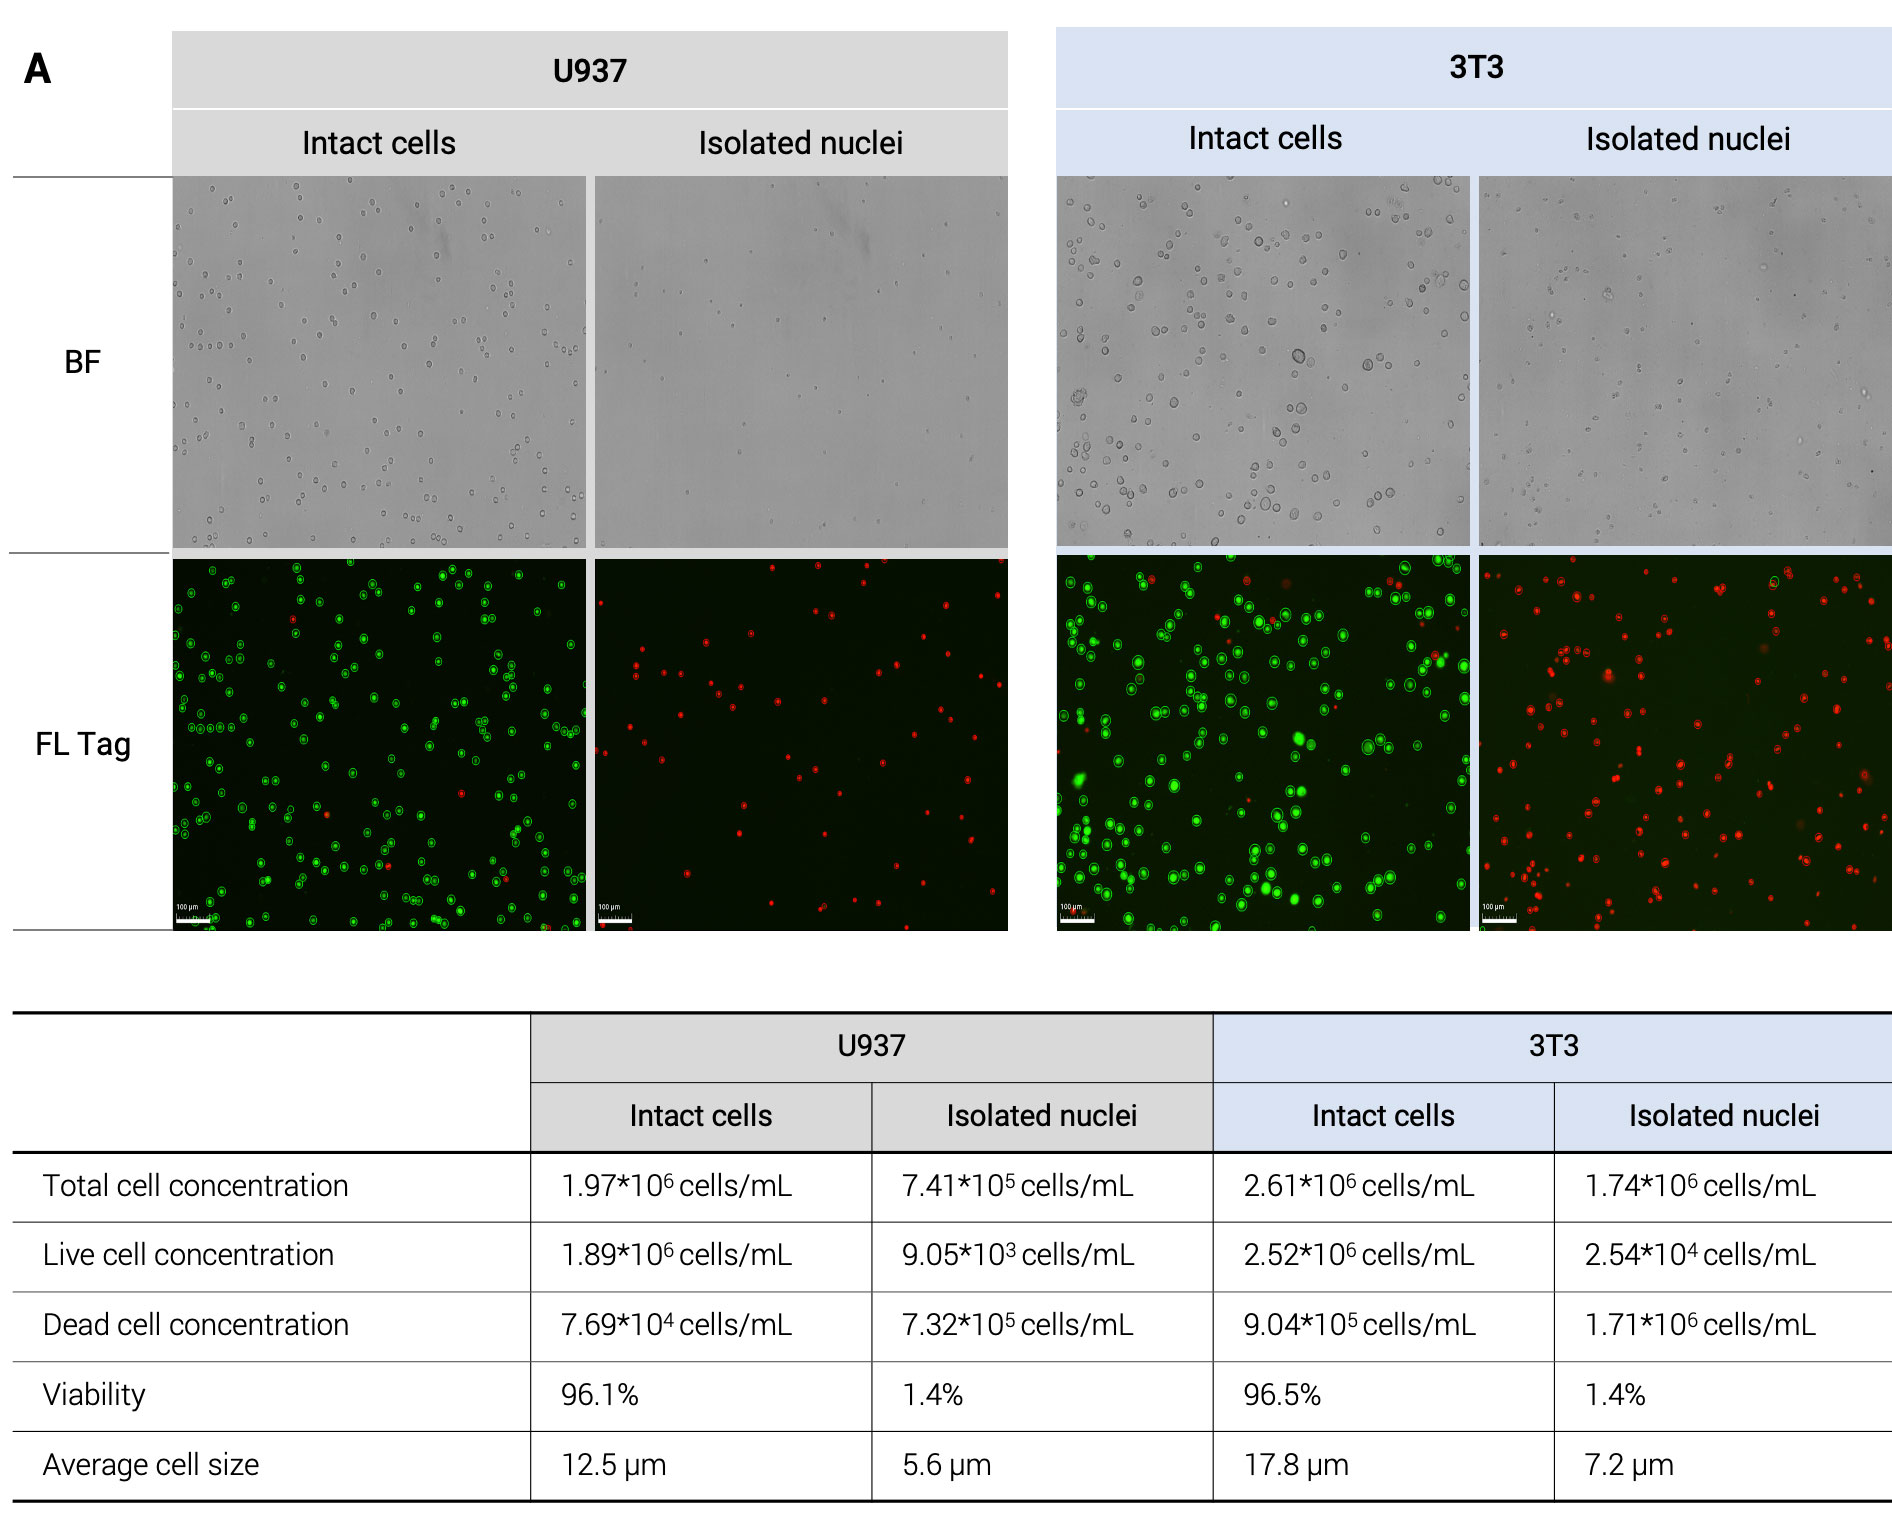
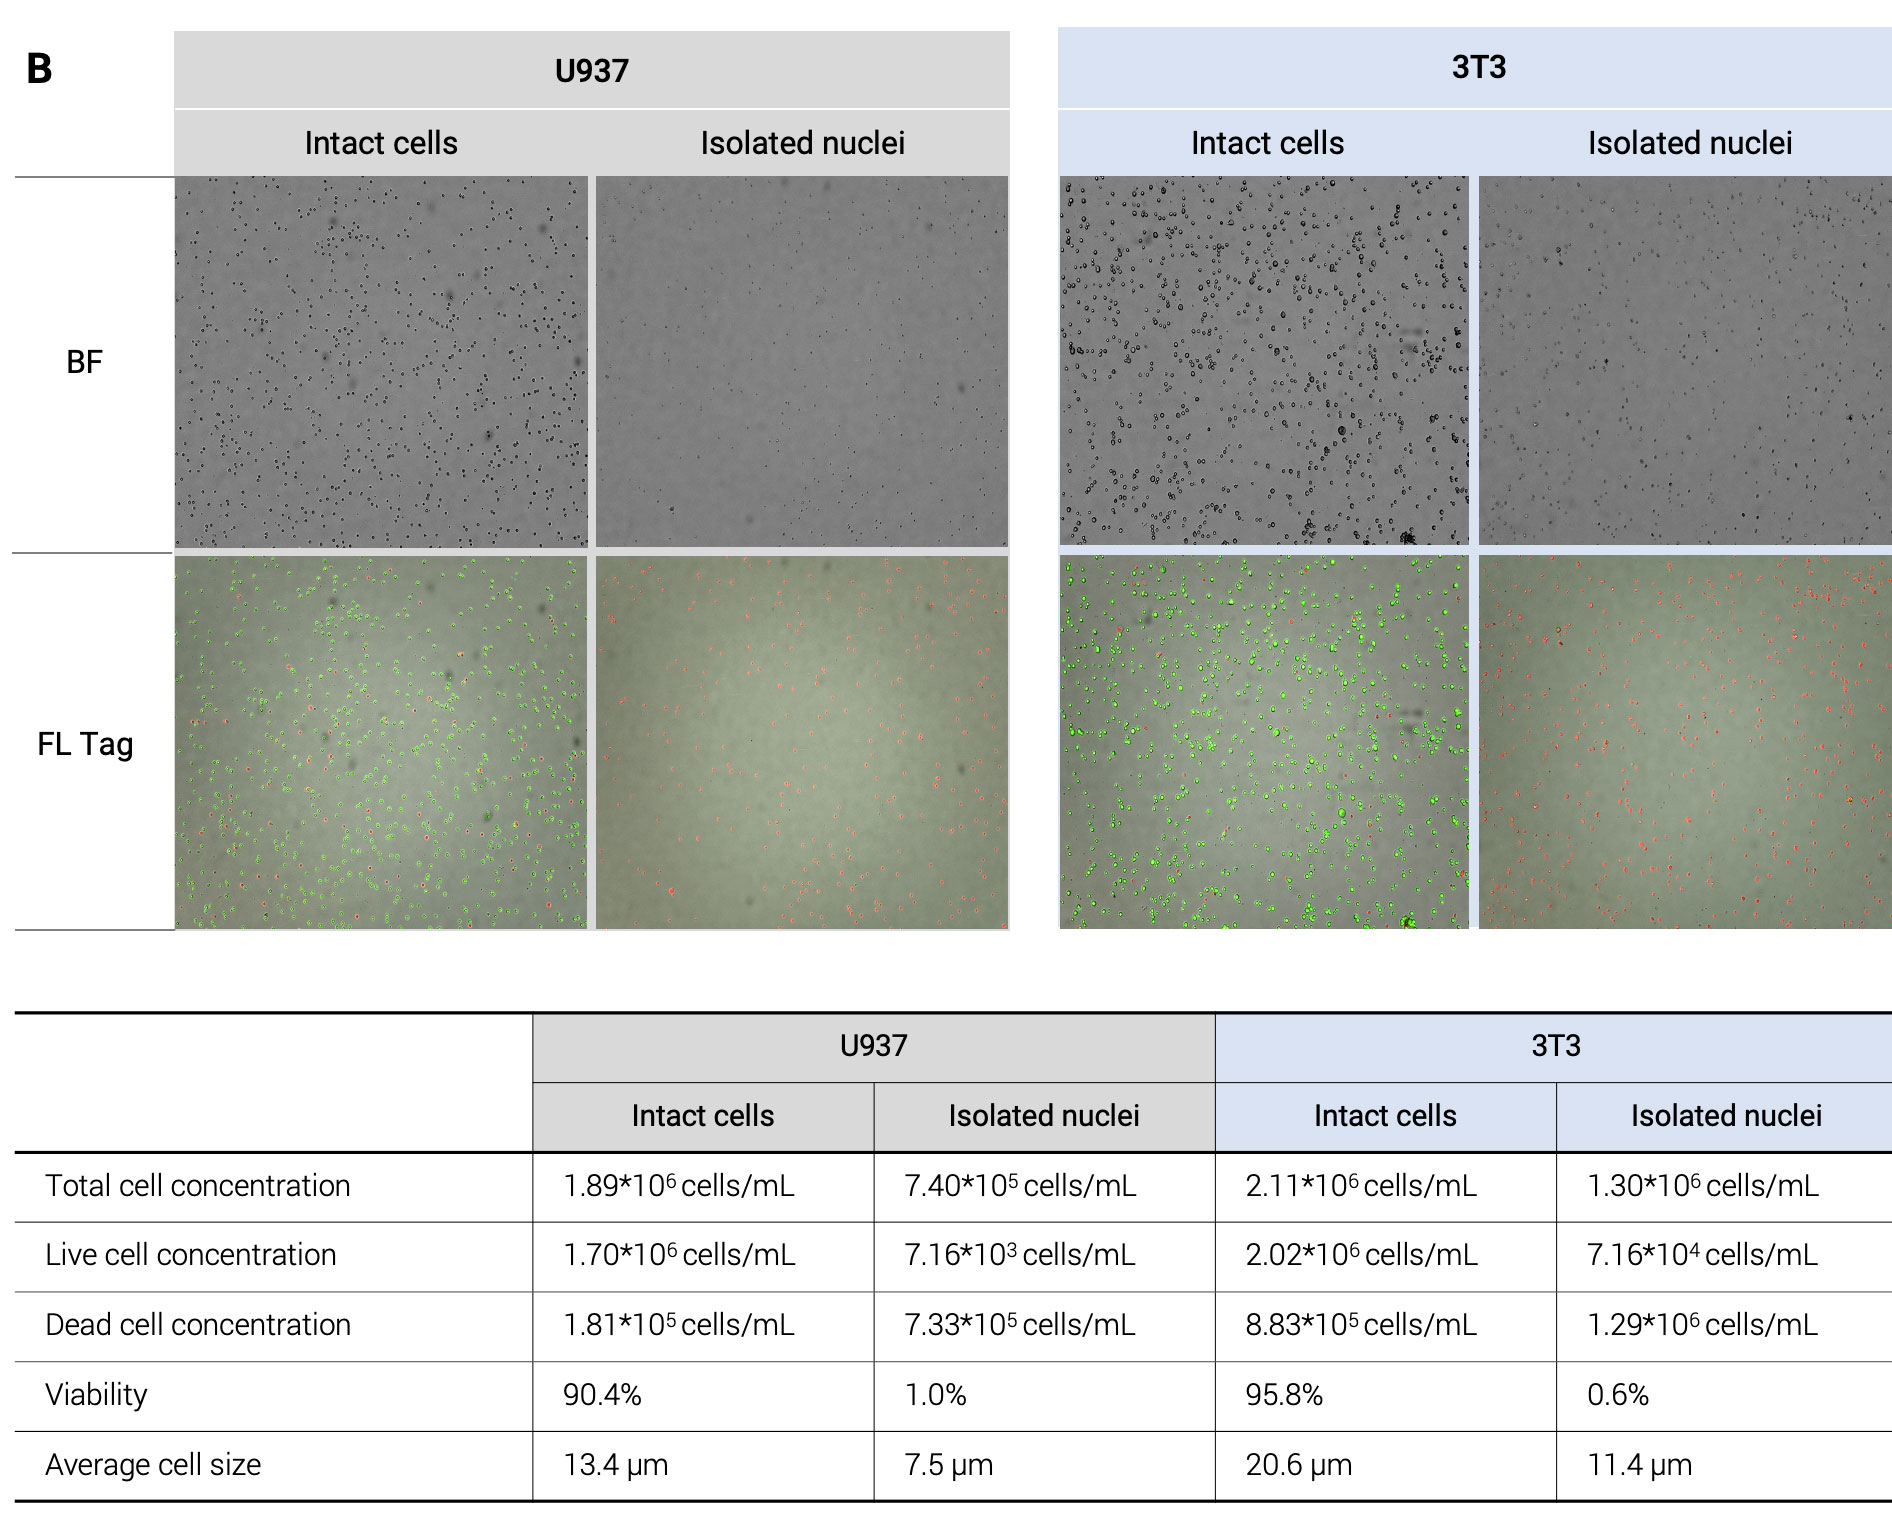
Figure 2: Montages displaying the staining results of different combinations, AO/PI, and AO/EthD-1, for U937 cells and 3T3 cells. The quantitative analyses from LUNA-FX7™ (A) and LUNA-FL™ (B) are also shown.
Nuclei fixation is a common practice for long-term storage, as it helps preserve cellular structures and enables subsequent analysis. Hence, to verify if the aforementioned nuclei quality assessment methods can be applied to fixed nuclei as well, we tested AO/PI and AO/EthD-1 on PFA-fixed nuclei. When using the AO/PI dye combination, a distinct and strong PI fluorescence signal was observed regardless of fixation status or dye incubation time. This indicates that the AO/PI dye can be used for both fresh isolated nuclei and fixed nuclei. In contrast, when using AO/EthD-1, there was a reduction in the red fluorescence of EthD-1 in fixed nuclei, and even with prolonged dye incubation, there was no increase in the fluorescence signal. To address this challenge, we adjusted the exposure value, increasing it from the default setting of 5 to 8. This adjustment led to stronger red signals, comparable to those achieved with the AO/PI combination. These findings suggest that when using the AO/EthD-1 dye, a reduction in fluorescence signal can be expected for fixed nuclei, as opposed to fresh isolated nuclei. Therefore, adjustments to the parameters of the automated cell counter may be necessary.
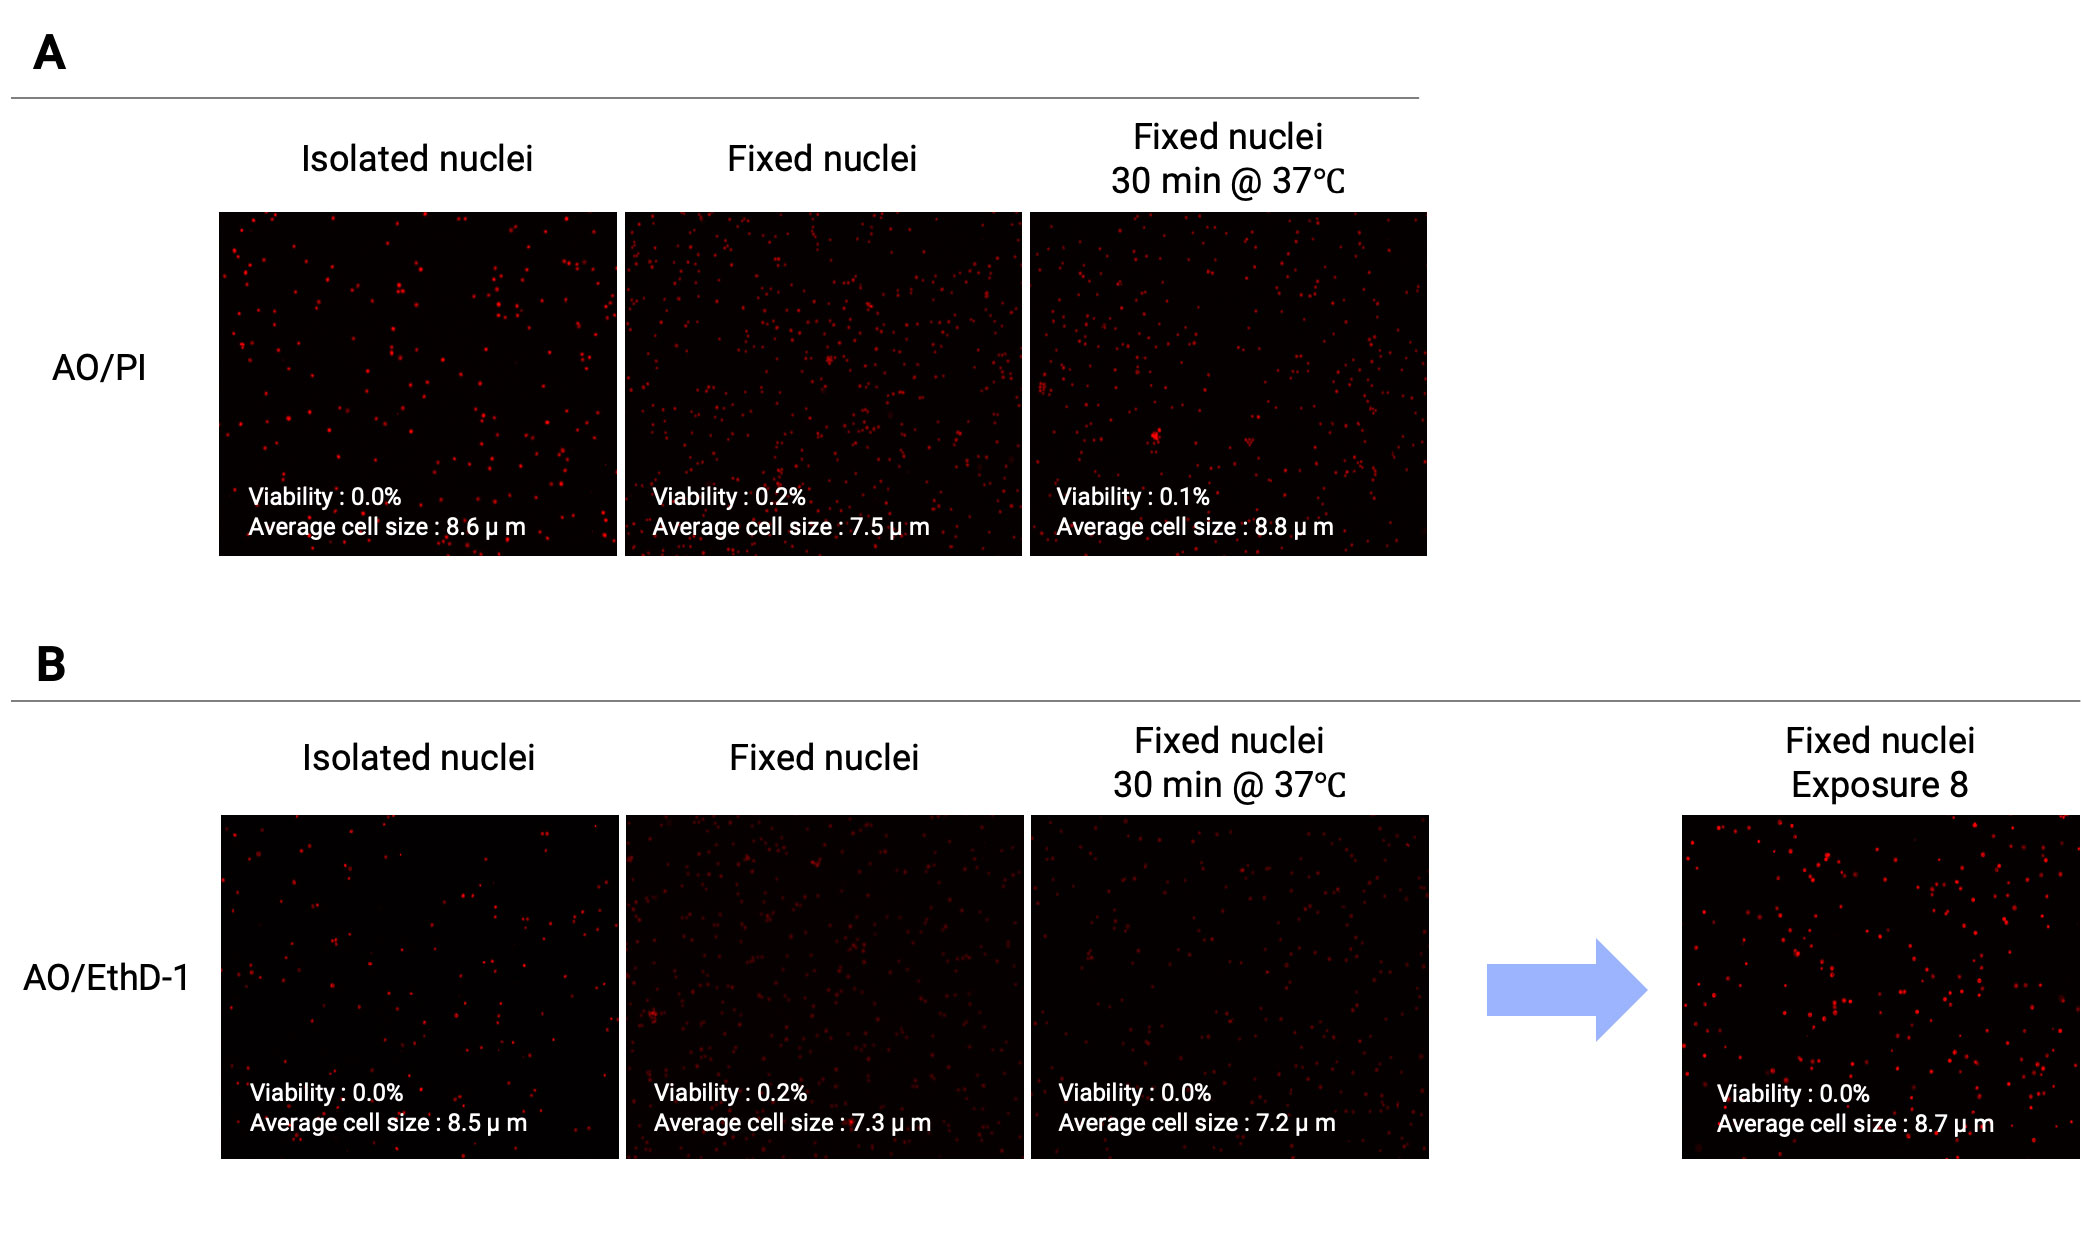
Figure 3: A montage showing the staining results of nuclei before and after PFA fixation using AO/PI and AO/EthD-1. The image obtained using an exposure setting of 8 is also displayed on the right.
In the rapidly evolving realm of single cell genomics research, the precise evaluation of nuclei quality stands as a cornerstone for dependable outcomes. Among the dye combinations assessed, AO/PI and AO/EthD-1 emerged as the most promising for distinguishing viability differences between intact cells and isolated nuclei. Notably, while AO/PI proved effective for both fresh and fixed nuclei, the AO/EthD-1 combination required optimization to achieve comparable results, especially for fixed nuclei. Our study has demonstrated a highly effective and reliable method by combining the appropriate dye compositions with the advanced LUNA-FX7™ and LUNA-FL™ systems to assess isolated nuclei quality. This well-established approach provides a valuable technique for assessing isolated nuclei, thereby contributing to the advancement of single cell genomics research.


