Key features
| High throughput screening (HTS) of phagocytosis with the CELENA® X High Content Imaging System |
| The optimized analysis pipeline used to evaluate phagocytosis of pHrodo™ Green labeled E. coli over time |
INTRODUCTION
Phagocytosis, simply put, is a process by which certain live cells, called phagocytes internalize foreign matter. This defensive reaction against infection is key in the study of immunology and plays an important role in immune responses, tissue homeostasis, and continuous clearance of apoptotic cells. Generally, phagocytotic activity is assayed using flow cytometry. However, this process only provides quantitative data and does not provide the means to monitor phagocytosis in real time. Here, we demonstrate the ability of the CELENA® X High Content Imaging System to monitor and quantify phagocytosis using pH-sensitive fluorescent particles, pHrodo™ Green.
APPLICATION
Cell preparation
RAW 264.7 cells were counted using the LUNA-II™ Automated Cell Counter and seeded at a density of 1 x 10⁴ cells/50µL/well in a half area 96-well plate overnight. Nuclei were counterstained with Hoechst 33342 (Life Technologies, H3570) for laser autofocusing. Cells were washed twice using the cell culture media to remove excess dye before imaging.
Imaging and analysis
Phagocytic activity was assayed by measuring the increase in fluorescence of RAW 264.7 cells over time after incubation with pHrodo™ conjugated E. coli (green). The use of pHrodo™ Green reduces signal variability and improved timing in sensitive experiments. In addition, fluorescence of the pHrodo™ Green dye dramatically increases as pH decreases from neutral to acidic making it an excellent tool for the study of phagocytosis. Imaging and analysis were performed using the CELENA® X High Content Imaging System, CELENA® X Cell Analyzer software, and the CX Stage Top Incubator Pro [Tokai] (95% humidity, 5% CO2, and 37℃). Time lapse image acquisition was performed at T0 (time point) and then at 30-minute intervals for 20 hours. Prior to starting live-cell imaging, the cell culture media was replaced with the fresh media containing 10 µg, 3 µg, and 0 µg of pHrodo™ Green conjugated E. coli (catalog number P35366; Life Technologies). Live-cell imaging started immediately after replacing the media. Images were captured using an Olympus 10X LWD high NA objective and an EGFP filter cube (Ex470/30, Em530/50). To quantify phagocytic activity over time, we measured the area and level of green fluorescence occupied by bright green fluorescence. Objects containing green fluorescence were identified using the ‘IdentifyPrimaryObjects’ module. The area of fluorescence was measured using the ‘MeasureImageAreaOccupied’ module (Table 1). To visualize the data, the ‘MaskImage’ module was used to eliminate areas of low signal. The ‘GrayToColor’ module was used to convert the grayscale images to color images (Figure 1).
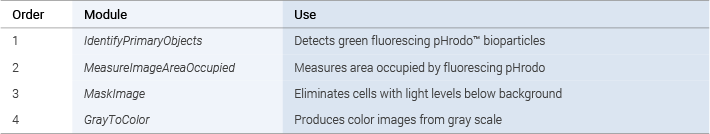
Table 1. Description of the pipeline used to assess phagocytosis with CELENA® X Cell Analyzer
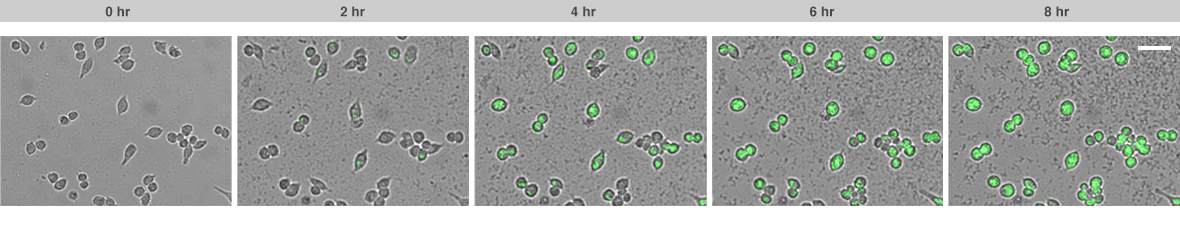
Figure 1. Time-lapse images acquired using CELENA® X system. The area occupied by bright green fluorescence increased over time (scale bar: 50 µm).
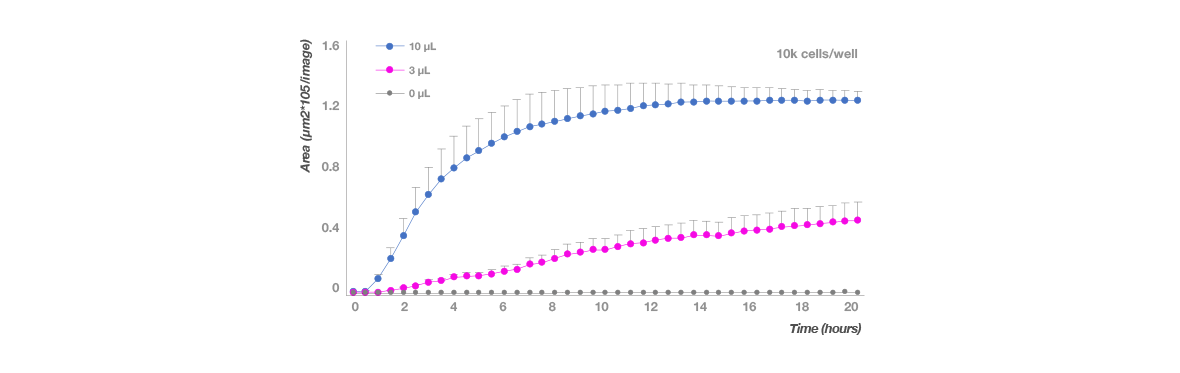
Figure 2. Quantification of phagocytosis. The area occupied by E. coli bioparticles with high GFP signal was measured. Phagocytosis was dependent on the quantity of E. coli bioparticles.
INTRODUCTION
In this study, we analyzed phagocytic activity against pHrodo conjugated E. coli bioparticles using the CELENA® X High Content Imaging System. Images were automatically taken and analyzed to identify objects, measure area, and apply colors to images for visualizing data. Phagocytic activity increased with a higher quantity of E. coli bioparticles as shown in Figure 1 and 2. Establishing the analysis pipeline was simple and straightforward. Overall, the CELENA® X High Content Imaging System, CELENA® X Cell Analyzer software, and CX Stage Top incubator proved to be an effective and efficient system for quantifying and monitoring phagocytotic activity.
4KB


