INTRODUCTION
Accurate assessment of cell concentration and viability is vital in cancer research, drug development, and immunotherapy, underpinning the evaluation of experimental outcomes and therapeutic efficacy. However, cell models with large and complex morphologies—such as A172 glioblastoma cells—are challenging to analyze with standard viability assays. Their size, adherent nature, and high cytoplasmic RNA content, can interfere with conventional staining and classification.
Automated cell counters like the LUNA-FX7™ can help overcome these challenges by enabling precise viability analysis with just a 5-minute incubation and optimized imaging parameters. The system supports multiple slide formats, including the PhotonSlide™, a well-established option for AO/PI-based assays. To further improve workflows and reduce variability, the SpectraSlide® AP-1 was developed. The slide comes with a pre-coated AO/PI surface and a “click–dip–release” loading mechanism reducing manual staining steps and minimizing hands-on time.
In this study, we compared the SpectraSlide® AP-1 and PhotonSlide™ for cell concentration and viability analysis. Using the A172 glioblastoma cell model, we validated the precision and performance of the SpectraSlide® AP-1.
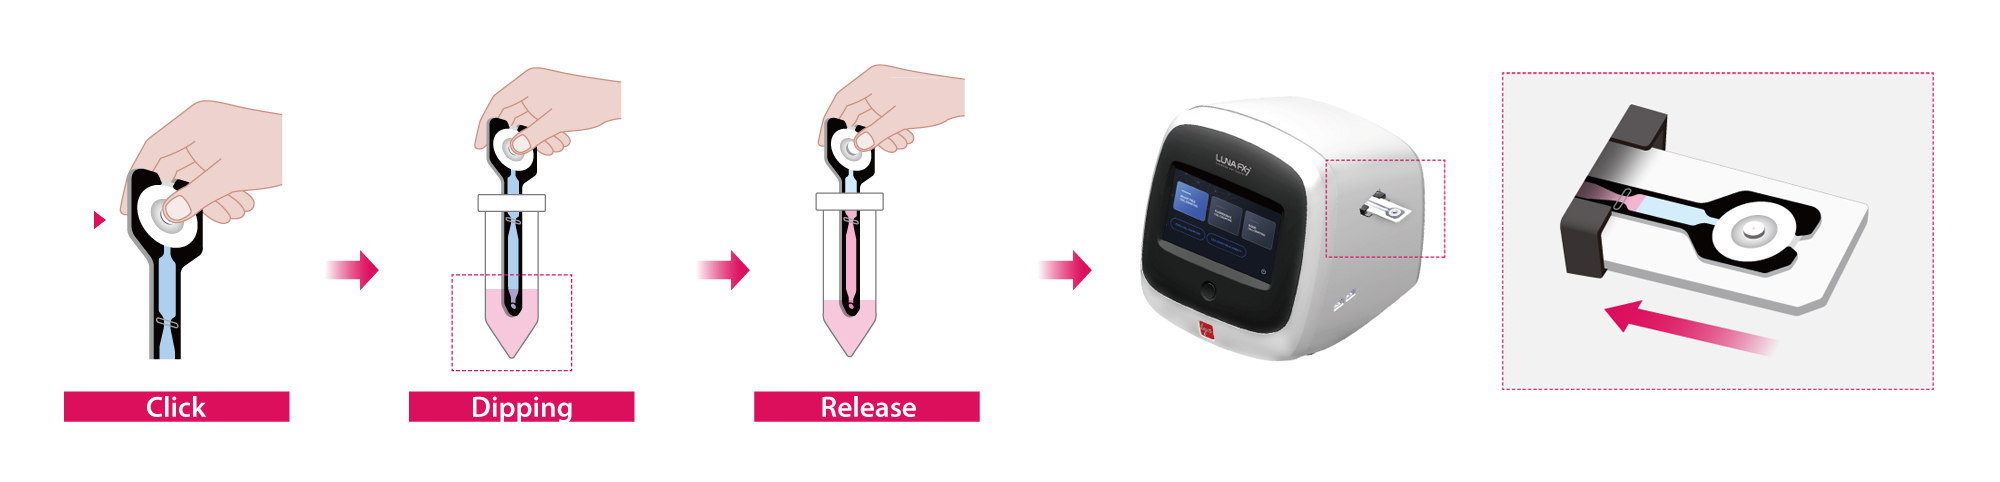
Figure 1: Illustration of the SpectraSlide® AP-1 workflow. Press the sampling button, dip the sampling hole in the sample, release to draw in the liquid, and insert the slide into the LUNA-FX7™ for automated cell counting.
MATERIAL AND METHODS
Cell Culture
A172 cells were cultured in Dulbecco’s Modified Eagle Medium (DMEM) supplemented with 10 % fetal bovine serum (FBS) and 1 % penicillin-streptomycin at 37 °C with 5 % CO₂.
Incubation Time and GF LED Adjustment
To assess the effects of incubation time and LED intensity on AO/PI-based viability analysis, A172 cells with a target viability of 50 % were stained and analyzed using the LUNA-FX7™ Automated Cell Counter (Cat# L70001). The PhotonSlide™ (Cat# L12005) was used to compare samples imaged immediately after loading (0 min) versus after a 5-minute incubation. For evaluating green fluorescence (GF) LED settings, the SpectraSlide® AP-1 (Cat# L72061) was used to compare viability measurements under GF intensities of level 6 and level 5.
Comparison of Cell Analysis Results in A172 Cells
Cell concentration and viability of A172 cells were evaluated using both the PhotonSlide™ and SpectraSlide® AP-1. For slide settings, the 2 Ch mode was selected when using the PhotonSlide™, whereas the Spectra mode was used for cell counting with the SpectraSlide® AP-1. All samples underwent a 5-minute incubation before imaging and analysis with the LUNA-FX7™ by using the optimized imaging parameters (Table 1).
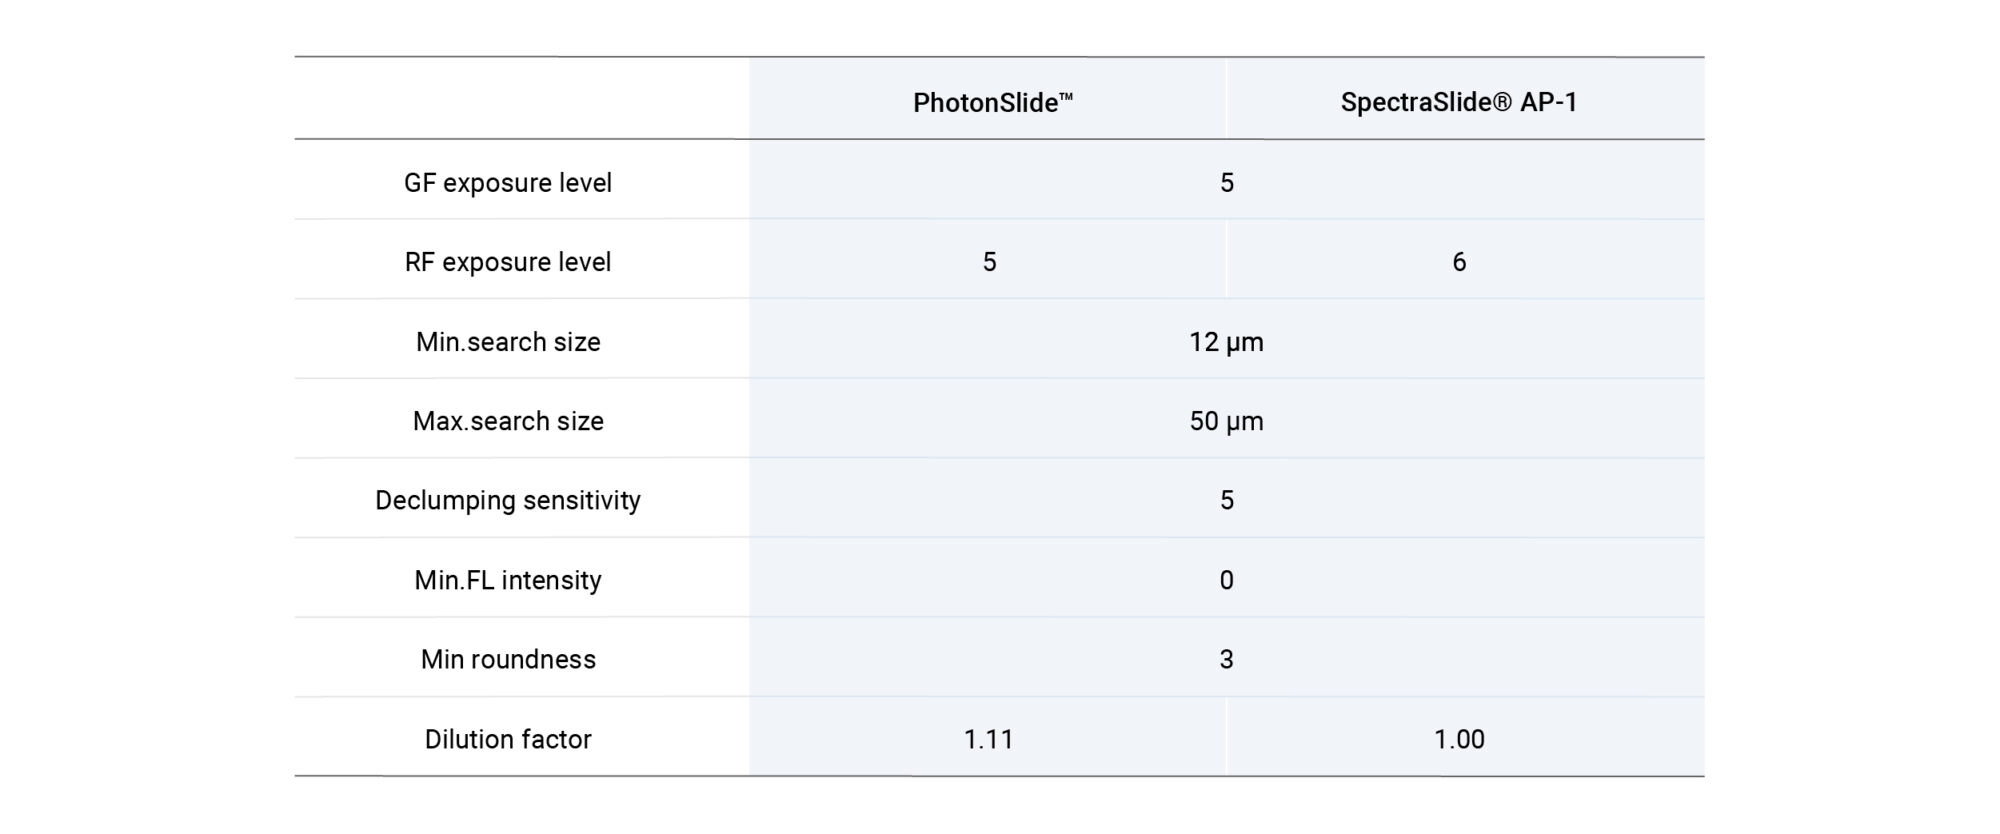
Table 1. Parameter settings used to count A172 cells with the PhotonSlide™ and SpectraSlide® AP-1 on the LUNA-FX7™ in Cell Lines & Primary cells, Advanced Fluorescence Cell Counting mode.
RESULTS
Optimizing Incubation Time and Imaging Parameters for Accurate AO/PI-Based Viability Assessment
Viability analysis of A172 cells was conducted using the PhotonSlide™ and SpectraSlide® AP-1 with the LUNA-FX7™ under varying staining and imaging conditions.
With the PhotonSlide™, fluorescence and overlay images taken at 0 minutes and after a 5-minute incubation showed improved separation of live and dead cells post-incubation, along with reduced green fluorescence in dead cells—indicating enhanced PI uptake and AO quenching (Figure 2A). Viability measurements decreased from ~70 % at 0 minutes to ~50 % after incubation, closely matching the expected target (Figure 2B).
With the SpectraSlide® AP-1, imaging at green fluorescence (GF) LED levels of 6 and 5 demonstrated reduced green signal and misclassifications at GF 5 (Figure 2C). At GF level 5, viability measurements were lower than at GF 6, dropping from ~70 % at 0 minutes to ~50 % after incubation—closely aligning with the expected target viability (Figure 2D).
Figure 2. (A) Fluorescence and overlay images comparing viability results at 0 minutes (top) and after a 5-minute incubation (bottom). Yellow arrows indicate dead cells misclassified as live.
(B) Bar graph comparing viability percentages before and after the 5-minute incubation (n=3).
(C) Fluorescence and overlay images at different green fluorescence (GF) LED settings: GF 6 (top) and GF 5 (bottom). Yellow arrows indicate dead cells misclassified as live.
(D) Bar graph comparing viability measurements between GF LED levels 6 and 5 (n=3).
BF: Images captured in the brightfield channel.
GF: Images captured in the green fluorescence channel.
RF: Images captured in the red fluorescence channel.
Tag: Composite images of all channels, fluorescent and brightfield, with identified objects marked using red and green circles. Red circles indicate dead cells, while green circles represent live cells.
Comparison of PhotonSlide™ and SpectraSlide® AP-1 for Analyzing A172 Cells
A172 cells were analyzed using both the PhotonSlide™ and SpectraSlide® AP-1 with the LUNA-FX7™ to compare cell concentration and viability results. Brightfield and fluorescence-tagged images showed comparable cell detection and classification across both slide types (Figure 3A). Quantitative analysis revealed similar cell concentrations of approximately 1.3 × 10⁶ cells/mL for both slide formats (Figure 3B). Viability measurements also remained consistent (Figure 3C), showing that—with a 5-minute incubation—both slide types support accurate and reproducible analysis of large, structurally complex cells such as A172.
Figure 3. (A) Representative overlay images of A172 cells stained with AO/PI and analyzed after a 5-minute incubation using the PhotonSlide™ (top) and SpectraSlide® AP-1 (bottom).
(B, C) Bar graphs showing comparable cell concentration (B) and viability (C) results between slide types (n = 10).
BF: Images captured in the brightfield channel.
Tag: Composite images of all channels, fluorescent and brightfield, with identified objects marked using red and green circles. Red circles indicate dead cells, while green circles represent live cells.
CONCLUSION
This study shows that the SpectraSlide® AP-1 is a reliable and easy-to-use tool for measuring cell concentration and viability when used with the LUNA-FX7™ Automated Cell Counter. Its performance was very similar to the well-known PhotonSlide™, proving that it works well with both CHO-K1 and HEK293 cells. The built-in AO/PI staining and simple “click–dip–release” workflow help reduce hands-on time and limit user error. With clear imaging of live and dead cells, the SpectraSlide® AP-1 is a strong choice for fast, consistent cell analysis in everyday biopharmaceutical research and production.


