Keywords
Transfection is a term to describe a process to introduce foreign genetic materials into eukaryotic cells. A number of transfection methods have been developed. Unfortunately, whatever method is used, the transfection efficiency is not 100%. Whereas this problem can be relieved to some extent by stable transfection, the variability in the transfection efficiency is inevitable in case of the transient transfection. To compare results obtained from different experiments, researchers need to determine the transfection efficiency every time they perform the transient transfection.
An easy and popular method to measure the transfection efficiency is to use a GFP gene. For example, by making a fusion protein between GFP and the protein of interest, the expression of the protein of interest can be measured by the presence of GFP protein.
The LUNA-FL™ fluorescence cell counter is equipped with an optical module for bright field signal and fluorescence signal detection. The optical specification of LUNA-FL™ is listed in table 2. Fluorescence channel 1 (FL1) is adequate for exciting GFP and receiving the emitted light from GFP. It can also detect signals from Yellow Fluorescence Protein (YFP) although the excitation efficiency is lower than GFP.
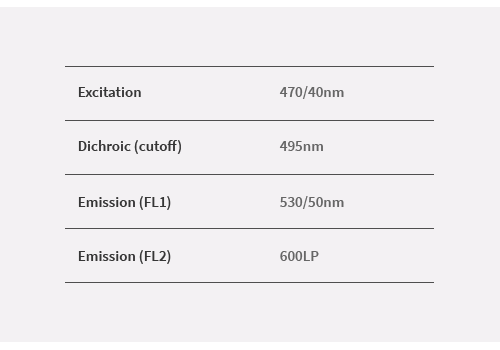
Table 2 . Optical specification of LUNA-FL™
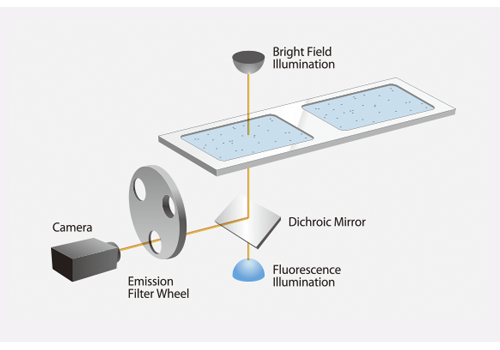
Figure 1 . Schematic of optical module of LUNA-FL™
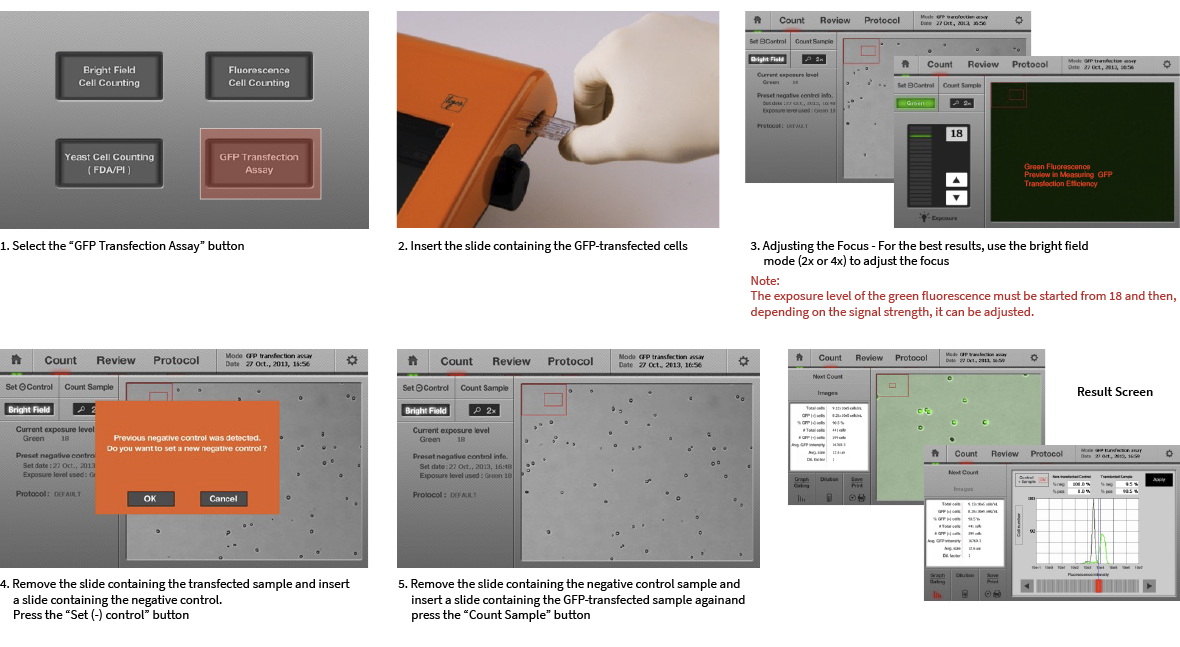
To measure the GFP transfection efficiency with the LUNA-FL™, 10 µL of negative control sample is analyzed first. The negative control can be a non-transfected control or a mock-transfected control. Through this step, the background fluorescence of the cell line is measured. Next, experimental samples are analyzed. Cells irradiating fluorescence stronger than the background level are considered as “transfected”. This strategy is just same to that of the most widely-used method, flow cytometry analysis.
By combining the hardware configuration of fluorescence microscopy and the algorithm of flow cytometry, LUNA-FL™ has merits of both instruments: reasonable price, no need of special training, no need of a dedicated operator, no maintenance issue, high accuracy and precision, and the applicability to challenging samples.
LUNA-FL™ calculates the concentrations of total cells and GFP positive cells in about 30 sec as shown in Fig 2. Additional information is displayed including the percentage of GFP positive cells, the numbers of total and GFP positive cells, and average size.
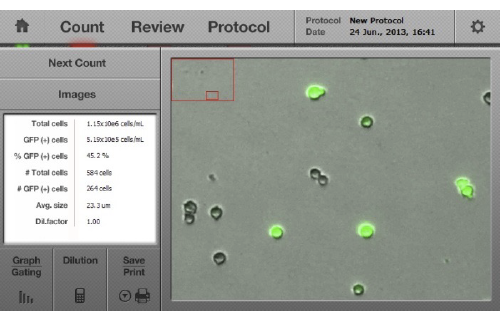
Figure 2. A result screen of a typical GFP transfection assay.
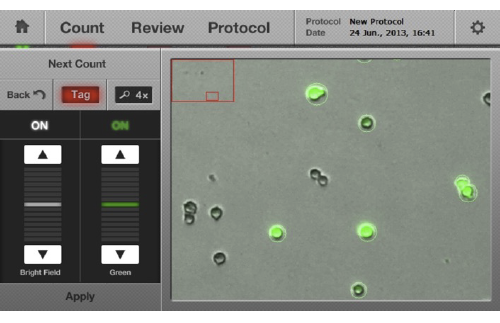
Figure 3. A result screen of a typical GFP transfection assay.
The accuracy of the GFP transfection assay can be verified on the LUNA-FL™ instrument itself by using the “tag” function. With this function on, cells considered as GFP-positive cells by a LUNA-FL™ software module are circled in green (Fig 3). By comparing the green fluorescence intensity of cells in the image and the presence of the green circle, users can easily verify the accuracy of the LUNA-FL™ software module. Users are also able to enhance the image quality by adjusting bright-field and green fluorescence images.
The distribution of GFP intensity and the cell number can be presented in a histogram format as flow cytometry (Fig 4). The graphs of a control and a sample are plotted, and the threshold is determined automatically. Users can manually change the threshold, and the percentage of GFP positive and negative cells will be reflected accordingly.
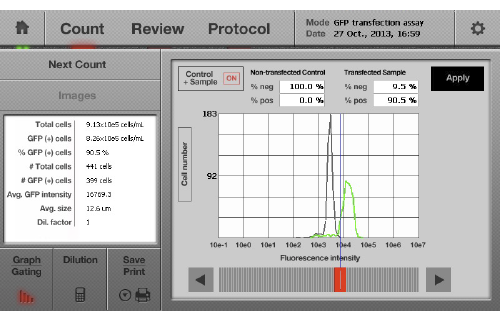
Figure 4. An analysis screen.
In addition to the cell counter function, LUNA-FL™ provides with cytometry function at no additional cost. Advantages of fluorescence microscopy and flow cytometry have successfully been combined to generate an ideal system to measure GFP transfection efficiency.
| Performance | Sample volume | 10 μL |
|---|---|---|
| Cell counting time | 30 sec | |
| Cell concentration range | 5 x 10⁴ ~ 1 x 10⁷ cells/ml | |
| Handware | Excitation wavelength | 470 ± 20 nm |
| Emission wavelength | 530 ± 25 nm (Green) 600 nm LP (Red) |
|
| Light Source | LED | |
| Image Resolution | 5 MP | |
| LCD | 7 inch | |
| Computer | on board | |
| Dimension (W x D x H) | 22 x 21 x 9 cm (8.6 x 8.3 x 3.5 inch) |
| Cat # | Description | Size |
| L20001 | LUNA-FL™ Fluorescence Cell Counter | each |
| L12005 | PhotonSlide™, 50 slides (100 counts) | Box |
| L12006 | PhotonSlide™, 500 slides (1,000 counts) | |
| L12007 | PhotonSlide™, 1,000 slides (2,000 counts) | |
| P10001 | LUNA™ printer | each |


