Accurate quantification of tissue-derived samples such as splenocytes and isolated nuclei is essential for a variety of downstream applications, including immunological assays, single-nucleus RNA sequencing (snRNA-seq), and ATAC-seq. Because of their small size, these samples are particularly difficult for image-based cell counters to analyze reliably, requiring both sensitivity and consistency. Automated systems like the LUNA-FX7™ have greatly improved counting workflows by replacing manual methods with high-throughput, imaging-based quantification. However, it still relies on manual AO/PI staining and require additional labware, which can increase complexity and variability—especially for users handling sensitive cell types.
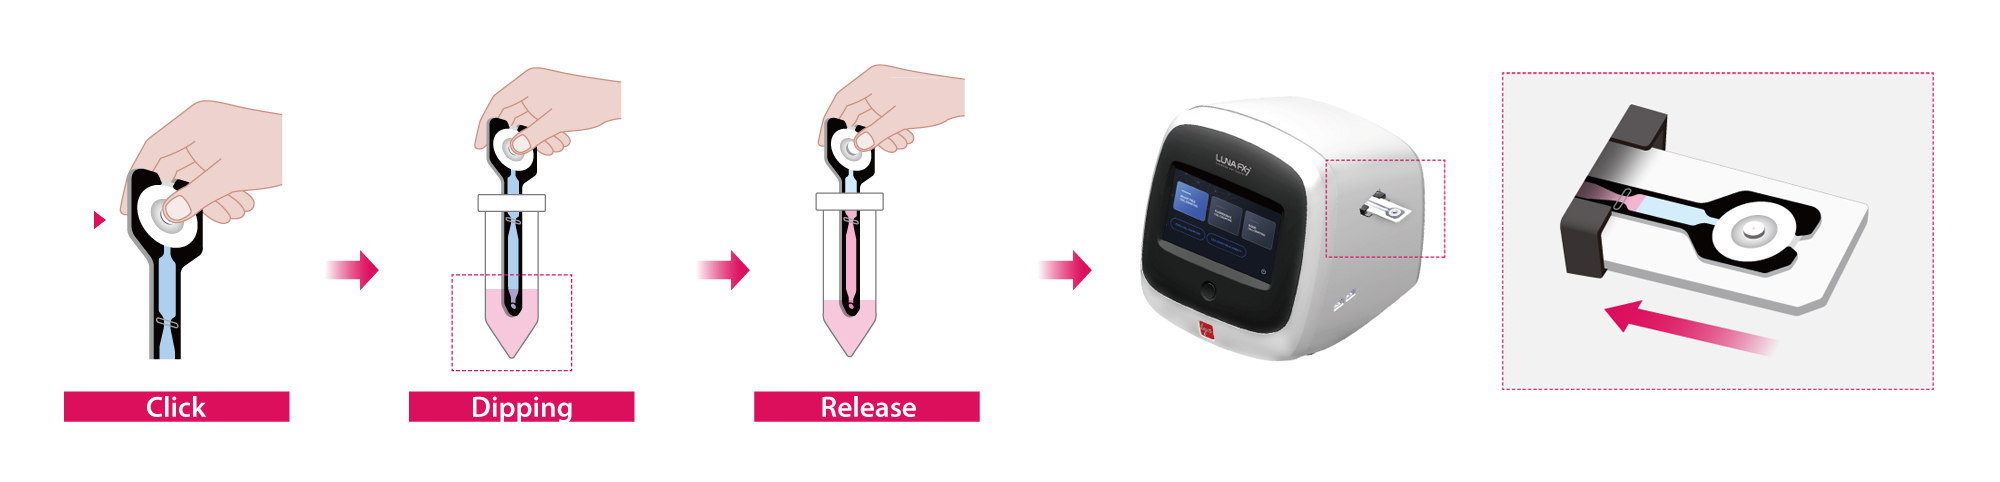
To overcome the limitations of conventional staining workflows, the SpectraSlide® AP-1 was developed as a user-friendly, pre-coated disposable slide that simplifies the cell counting process without compromising accuracy. Pre-loaded with acridine orange (AO) and propidium iodide (PI), it does not need separate dye preparation and staining steps. The intuitive “click–dip–release” sample loading method (Figure 1) allows for quick and consistent sample application, followed by immediate analysis using the LUNA-FX7™ automated cell counter. By combining integrated staining with an easy-to-use loading mechanism, the SpectraSlide® AP-1 significantly streamlines the cell counting workflow. This application note evaluates the performance of the SpectraSlide® AP-1 paired with the LUNA-FX7™, focusing on its effectiveness in analyzing tissue-derived samples including splenocytes and isolated nuclei.
MATERIAL AND METHODS
Sample preparation
Splenocyte isolation
Mouse spleens were collected and mechanically dissociated using a syringe plunger. The suspension was filtered through a 20 µm strainer and centrifuged at 500 × g for 5 minutes. The pellet was treated with RBC lysis buffer for 1 minute at room temperature, followed by the addition of 10 mL PBS to stop the reaction. After a second centrifugation at 500 × g for 5 minutes, the pellet was resuspended in RPMI medium for use.
Nuclei isolation
U-937 cells were centrifuged, and the pellet was resuspended in lysis buffer. After a 5-minute incubation at room temperature, the sample was washed with RPMI and centrifuged. The resulting nuclei pellet was resuspended in RPMI and used for the experiment.
Settling Time Test
To evaluate settling time, a time-lapse imaging experiment was performed using splenocyte suspensions loaded onto the PhotonSlide™. After slide preparation, each sample was immediately inserted into the LUNA-FX7™ automated cell counter, and images were captured every 20 seconds until the cells had completely settled into the focal plane.
Linearity of Cell Concentration and Viability
To evaluate the linearity of cell concentration and viability measurements, experiments were conducted using the LUNA-FX7™ automated cell counter with a customized protocol in Advanced Mode (Table 1). Splenocytes and isolated nuclei were serially diluted from initial concentrations of 1×10⁷ cells/mL and 8×10⁶ cells/mL, respectively, down to 5×10⁵ cells/mL. For viability assessment, live cells were harvested from actively proliferating cultures, while dead cells were generated by heat inactivation at 100 °C for 30 minutes. Defined mixtures of live and dead cells were then prepared to achieve target viability levels of 0 %, 25 %, 50 %, 75 %, and 100 %. Each sample was subsequently loaded onto either the PhotonSlide™ or the SpectraSlide® AP-1 for analysis.
For PhotonSlide™, the 2 Ch mode was selected, and 18 µL of the cell mixture was stained with Acridine Orange/Propidium Iodide (AO/PI) reagent (Cat# F23001) at a 9:1 ratio. 10 µL of the stained sample was loaded into the slide chamber. For SpectraSlide® AP-1, the Spectra mode was selected. 500 µL of cell samples were prepared in 1.5 mL tubes and loaded directly into the slide without additional staining steps.

Optimal Settling Time for Accurate Small Cell Analysis
To investigate the settling behavior of small, low-density cells, time-lapse imaging was performed using splenocyte suspensions loaded onto the PhotonSlide™. Over time, previously out-of-focus cells gradually moved into the focal plane, as indicated by the increasing sharpness and contrast of individual cells (Figure 1). This observation confirms that a brief waiting period—typically 1 to 2 minutes—is necessary for small cells like splenocytes to settle fully.
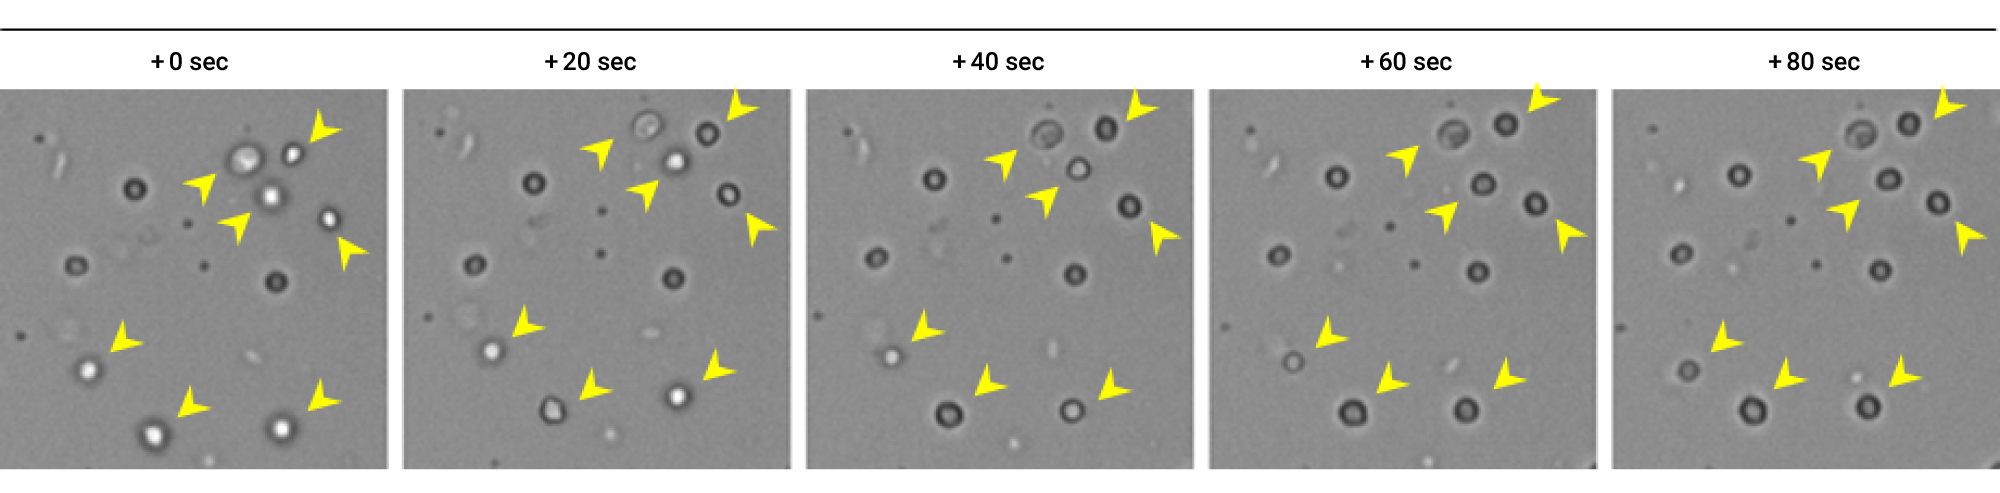
Figure 2. Optimal Settling Time for Accurate Small Cell Analysis
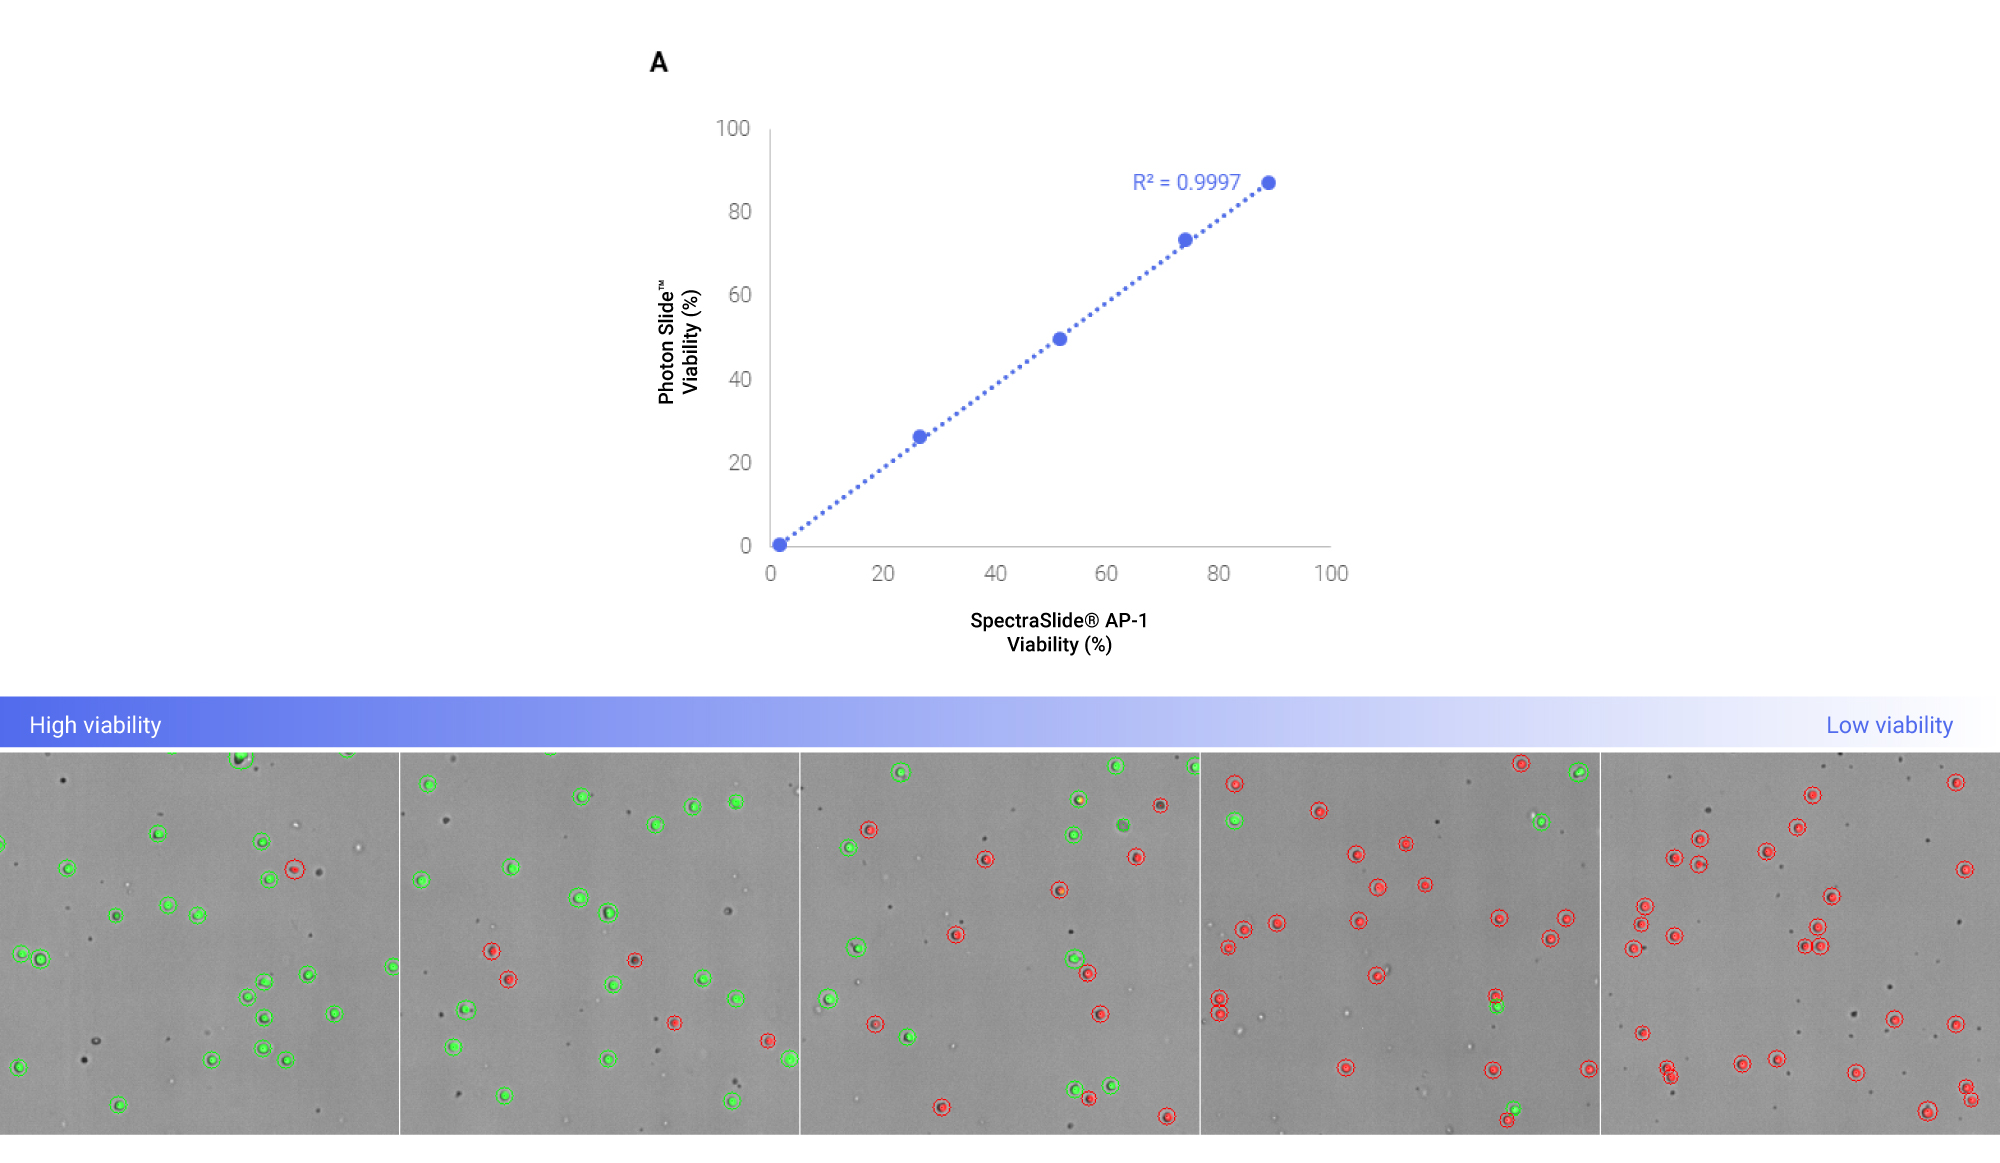
Viability Linearity of Splenocytes Using the SpectraSlide® AP-1 and the PhotonSlide™
To assess viability linearity, splenocyte samples were analyzed using the LUNA-FX7™ automated cell counter with both the SpectraSlide® AP-1 and the PhotonSlide™. Across a full range of viability conditions, the LUNA-FX7™ demonstrated excellent correlation between the two slide types, with SpectraSlide® AP-1 achieving a correlation coefficient (R²) value of 0.9997, showing excellent agreement with the PhotonSlide™ (Figure 2A). Montage images confirmed clear and consistent differentiation of live and dead cells at all tested viability levels (Figure 2B). Importantly, the system maintained high accuracy even in low-viability samples, where increased AO signal and background debris could otherwise interfere with detection. These results validate the SpectraSlide® AP-1 as a reliable, streamlined alternative for viability analysis of small, sensitive cells.
Performance Comparison of SpectraSlide® AP-1 and PhotonSlide™ for Accurate Cell Quantification
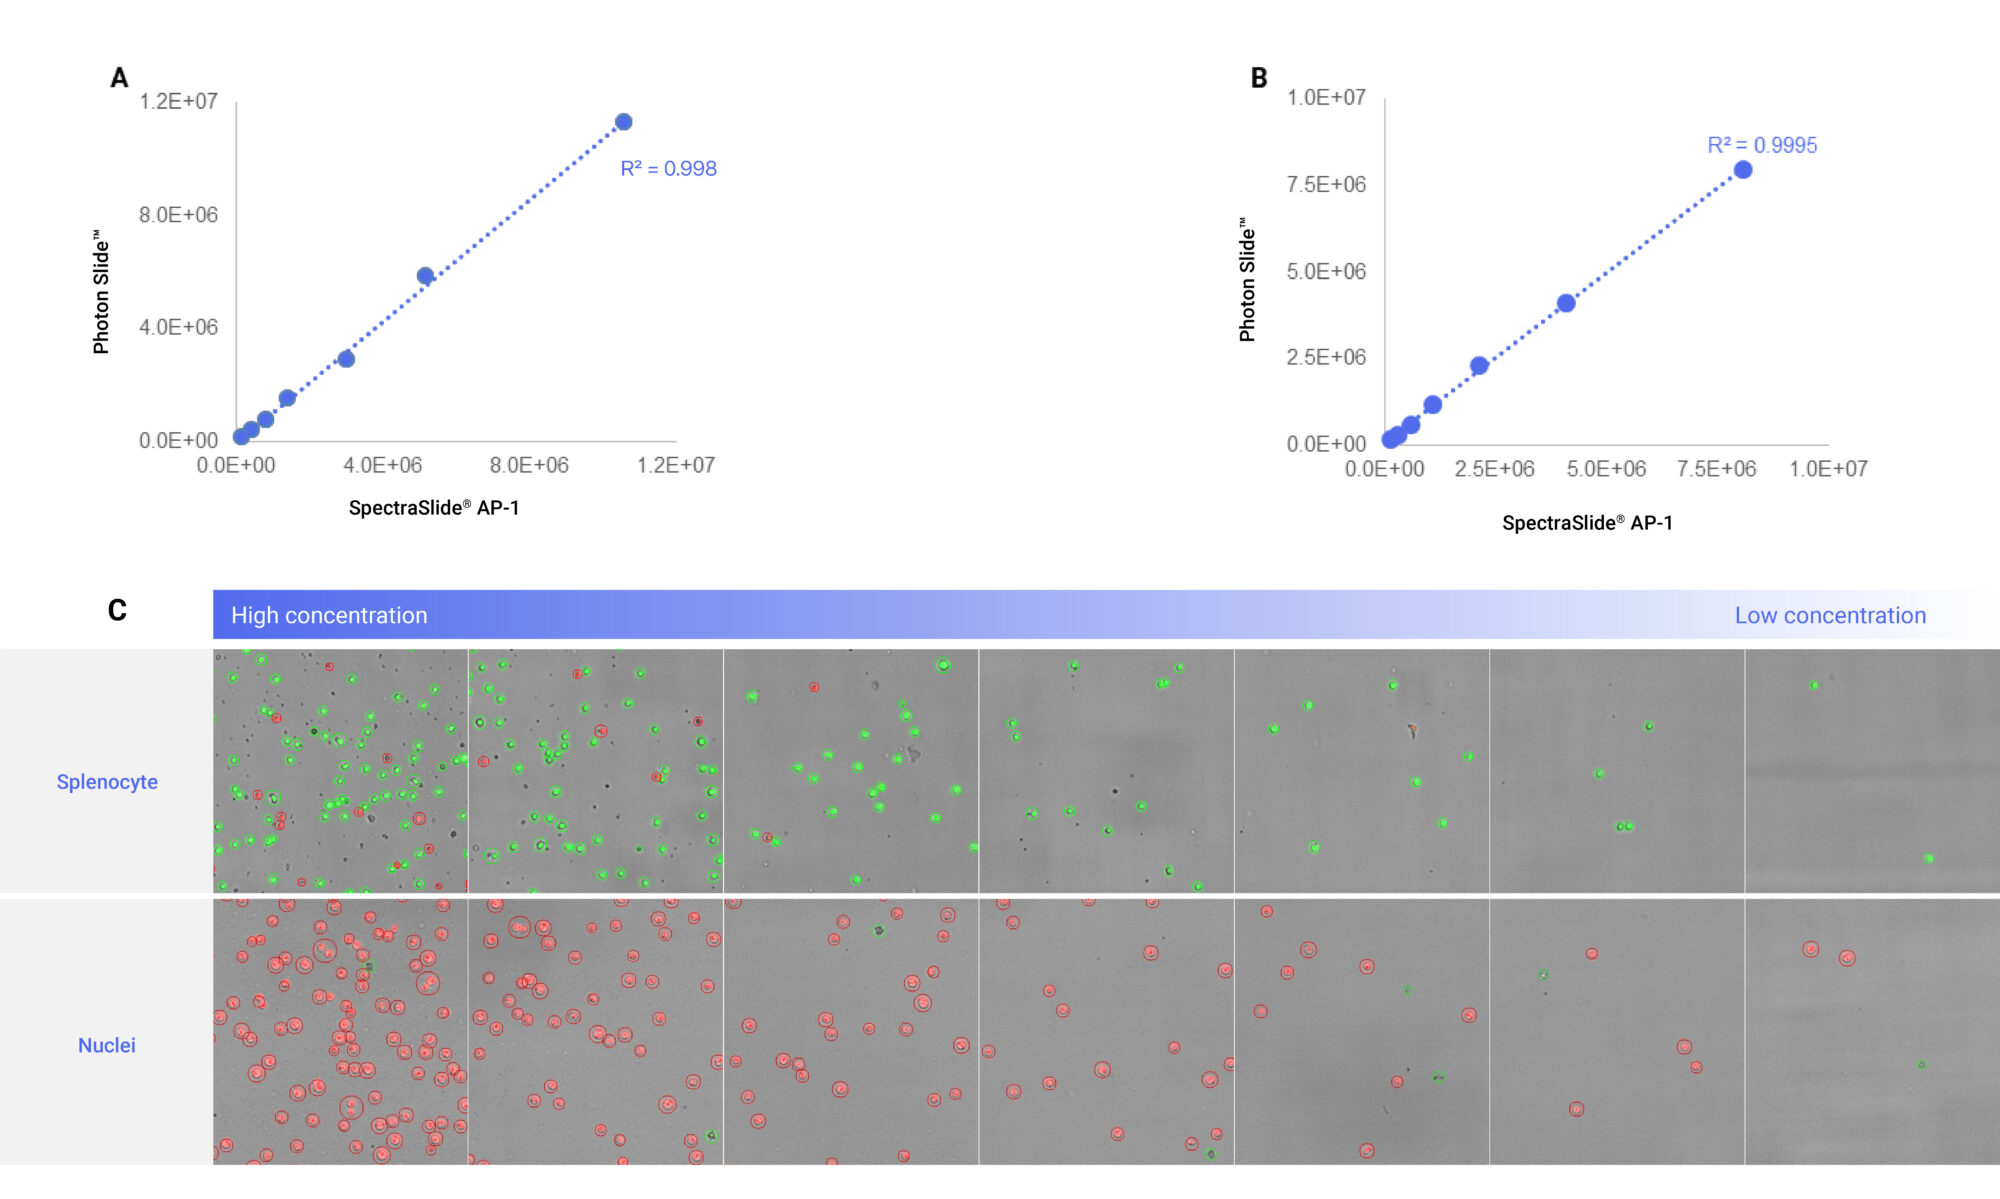
The performance of the SpectraSlide® AP-1 was evaluated by comparing its cell counting accuracy to that of the widely used PhotonSlide™ across a 7-point dilution series of splenocytes and isolated nuclei. Both sample types were analyzed using the LUNA-FX7™ automated cell counter. Splenocyte counts obtained with the two slide types showed strong agreement, with R² of 0.9980, confirming high consistency in concentration measurement (Figure 3A). Likewise, nuclei count showed excellent linearity, with an R² value of 0.9995 (Figure 3B).
Images further validated the detection performance across concentration ranges, from high to low concentration (Figure 3C). Live (green) and dead (red) cells were accurately identified and clearly visualized under both conditions, even in samples with increased debris.
This study shows that using SpectraSlide® AP-1 with the LUNA-FX7™ offers a simple and reliable way to analyze small cells like splenocytes and nuclei. The slide comes pre-coated with AO/PI, allowing users to skip manual staining and reduce hands-on steps. Across both viability and concentration measurements, SpectraSlide® AP-1 showed excellent linearity and performance comparable to the PhotonSlide™, even in low-viability or debris-rich conditions. Additionally, the importance of allowing a brief settling period was confirmed to improve imaging focus and measurement accuracy. Together, these results highlight the SpectraSlide® AP-1 as a reliable, time-saving alternative for high-throughput and sensitive cell analysis workflows.


