Keywords
Accurate quantification of suspension cell lines such as HL60 and Jurkat Cells are essential for a variety of applications in immunology, hematology, and other cell-based assays. These cell types are commonly used in high-throughput workflows and are typically processed in large volumes. Accordingly, achieving precision and consistency in cell counting is essential for ensuring the reliability and reproducibility of experimental outcomes.
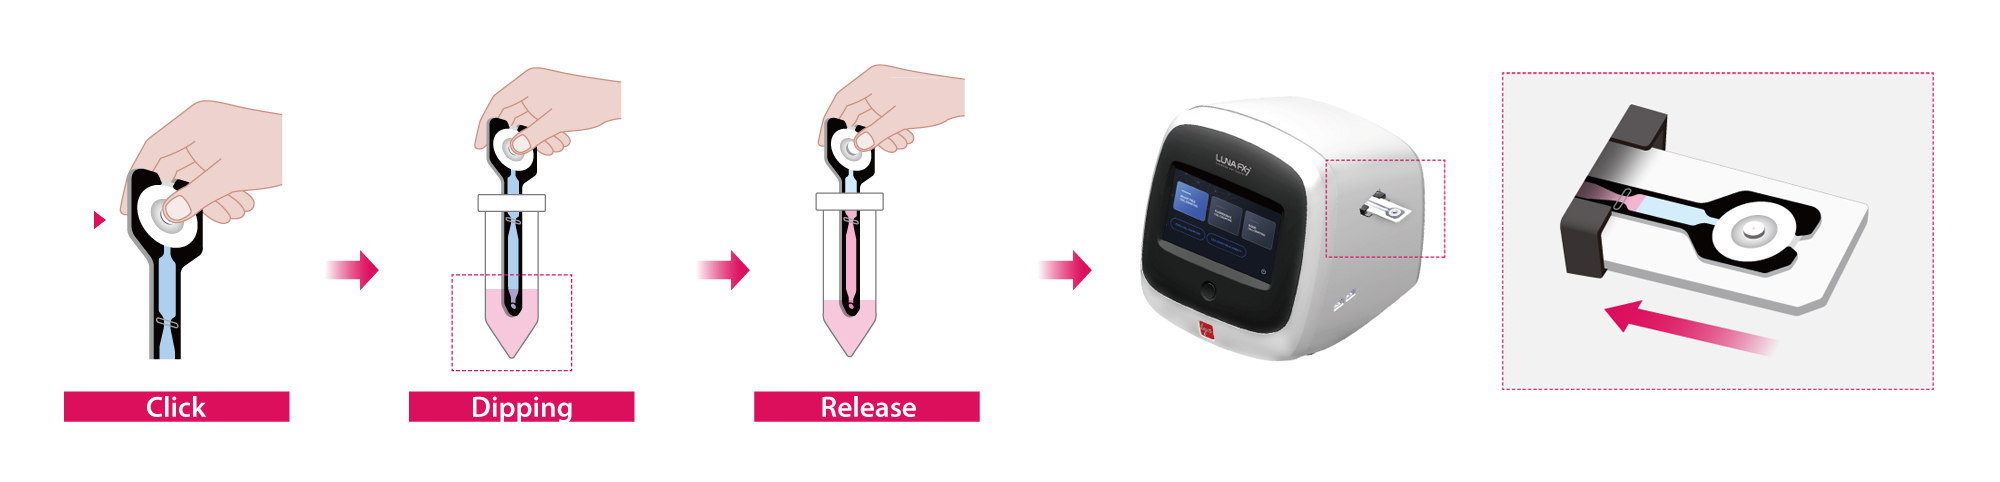
The LUNA-FX7™ Automated Cell Counter, using acridine orange (AO) and propidium iodide (PI) dual fluorescence staining, provides a robust and efficient platform for assessing both cell concentration and viability. The PhotonSlide™ has served as a reliable standard for sample loading, and the SpectraSlide® AP-1 further enhances this workflow with pre-coated AO/PI staining and an intuitive “click–dip–release” design. This design eliminates the need for manual dye preparation and minimizes user-to-user variability during slide handling.
In this application note, we compare the performance of the SpectraSlide® AP-1 against the PhotonSlide™ for viability and concentration analysis of HL60 and Jurkat Cells using the LUNA-FX7™.
Cell Lines and Reagents
HL60 and Jurkat Cells were cultured under standard conditions in RPMI-1640 medium supplemented with 10 % fetal bovine serum and 1 % penicillin-streptomycin. Actively growing cells were harvested.
Comparison Between the SpectraSlide® AP-1 and the PhotonSlide™
Cells were prepared for concentration and viability measurements with a target viability of 50 %. Cell counting was performed on the LUNA-FX7™ using either the PhotonSlide™ (Cat# L12005) or SpectraSlide® AP-1 (Cat# L72061) under the default Fluorescence Cell Counting protocol. For PhotonSlide™, the 2 Ch mode was selected, and 18 µL of the cell mixture was stained with Acridine Orange/Propidium Iodide (AO/PI) reagent (Cat# F23001) at a 9:1 ratio. 10 µL of the stained sample was loaded into the slide chamber. For SpectraSlide® AP-1, the Spectra mode was selected. 500 µL of cell samples were prepared in 1.5 mL tubes and loaded directly into the slide without additional staining steps
To assess the overall performance of the SpectraSlide® AP-1, both HL60 and Jurkat Cells were evaluated using the LUNA-FX7™ and compared with results obtained using the PhotonSlide™. Representative montage images of each cell type illustrate consistent detection of viable (green) and non-viable (red) cells across both slide types (Figure 2 A and B). The images confirm that the SpectraSlide® AP-1 enables high-quality fluorescence segmentation, comparable to the PhotonSlide™, for both cell types.
Quantitative analysis showed that cell concentrations measured with the SpectraSlide® AP-1 closely matched those obtained with the PhotonSlide™ for both HL60 (~2.4 × 10⁶ cells/mL) and Jurkat Cells (~2.8 × 10⁶ cells/mL) (Figure 2 C and D). Viability percentages were comparable between the two slide types for both HL60 and Jurkat Cells, with only minimal variation observed (Figure 2E and F).
Figure 2. (A, B) Representative montage images of HL60 cells (A) and Jurkat Cells (B) captured on the LUNA-FX7™. The left panel shows unstained brightfield images, while the right panel displays fluorescence overlays with viable cells stained green and non-viable cells stained red. (C, D) Bar graphs comparing total cell concentrations obtained using the PhotonSlide™ and SpectraSlide® AP-1 for HL60 (C) and Jurkat (D) cells. (E, F) Viability percentages for HL60 (E) and Jurkat (F) cells, showing close agreement between the two slide types. BF: Images captured in the brightfield channel. Tag: Composite images of all channels, fluorescent and brightfield, with identified objects marked using red and green circles. Red circles indicate dead cells, while green circles represent live cells.
This study confirms that the SpectraSlide® AP-1 , when paired with the LUNA-FX7™ Automated Cell Counter, provides accurate and consistent measurements of cell concentration and viability. Across both HL60 and Jurkat cells, performance of the SpectraSlide® AP-1 was comparable to the PhotonSlide™, with closely matching values for total cell concentration and viability.
The pre-coated AO/PI staining and simplified “click–dip–release” loading workflow of the SpectraSlide® AP-1 offer a significant advantage by eliminating the need for manual dye preparation and reducing variability due to handling.
Together, these results establish the SpectraSlide® AP-1 as a robust, efficient, and user-friendly alternative to traditional slides for routine viability and concentration analysis of suspension cells in both research and industrial laboratory settings.


