Key features
| High throughput screening of membrane potentials with the CELENA® X automated microscope system. |
| ATP inducible Fluo-8® AM esters into live cells for Kinetic live cell imaging. |
| The optimized analysis pipeline to evaluate ATP-induced intracellular calcium flux. |
INTRODUCTION
Calcium is an essential element found in all living organisms and is necessary for many functions at the cellular level. Calcium migrates across cell membranes and permits the activation and inhibition of a variety of enzymes through embedded calcium ion channels [1-3]. These calcium ions are responsible for facilitating muscle relaxation and contraction, as well as, vascular contraction and vasodilation, neuronal signal transmission, and hormone secretion [4-6]. This assessment evaluates the changes of intracellular calcium flux conditions on bovine aortic endothelial cells (BAEC) by adding ATP agonist [7]. The Fluo-8® AM, a acetoxymethyl ester of fluorescent indicator dye, is hydrolyzed intracellularly in the presence of calcium ions. Thus, the combinations of Fluo-8® AM and ATP agonist were used to detect changes in intracellular calcium efflux levels in the live cells. A 3-minute time-lapse was set for monitoring the BAEC cellular calcium efflux activated by the ATP stimulant forced the intercellular G protein-coupled receptors to release intracellular calcium ions [8].
APPLICATION
Cell preparation
The application used combined bovine aortic endothelial cells (BAEC) with Fluo-8® AM, which is a cell-permeable calcium indicator assay. BAEC is a reputable endothelial cell line that efficiently provides a model system to measure calcium permeability of the cellular characteristics. To evaluate the calcium ion efflux, the healthy BAEC were first seeded in the media of DMEM with 10 % fetal bovine serum and penicillin-streptomycin overnight at 20,000 cells/100 μl/well in a 96-well plate (SPL, 30296) for 16 hours. The culture media were aspirated, and the cells were incubated with 5 μM of Fluo-8® AM and 2.5 mM ReadiUse™ probenecid in Hanks and Hepes buffer (HHBS) at room temperature (protected from light) for one-hour incubation (AATbio.com Cat. 21080 & Cat. 20062). Then, the media was removed, and the wells were washed with 100 µL DPBS according to the manufacturer’s instructions. The 500 μM stock solution of ATP in DPBS was prepared in advance, and the 20 μl of ATP stock was ready to add on each well of 96-well plate to make ATP final concentration of 20 μM (Fishersci, Cat AC1028001000). For acquisition of images, the cell plate was placed on the stage of the CELENA® X system and set CELENA® X Explorer time-lapse function for 3-min scanning of images and capturing speed of 4 images in a second (4 fps, as fast as possible) with 10X objective. The scanning started immediately after gently applying the 20μl of the prepared ATP stock to each well of the plate. Next, the analysis was performed through the pipeline with the six following modules to quantify membrane potential of calcium mobilization; ①AddsingleImage module to select an image(Time 0) that will be used to create a mask image, ②IdentifyprimaryObjects module to find the individual cells in Time 0 image by the boundary of fluorescent signals. Next ③MaskImage module to mask image using the object identified in the previous step, ④MeasureObjectIntensity module to measure and quantify the intensity of the fluorescent, ⑤GrayToColor module to convert mono images to green pseudocolor images, and ⑥OverlayOutlines module to draw the outlines each cell. They are using the result file saved as .CSV format, the calcium mobilization of the total and several represented cells were plotted over time (Fig1). The selected time-lapse images of intracellular calcium changes were presented at 0 s, 10 s, 20 s, 40 s, and 160 s, and they were exhibited the Fluo-8® signals elicited higher levels of transient during 10 to 40 second in intracellular calcium ion responding fluorescent, and the highest total intensity was plotted on the 35 s (Fig. F).
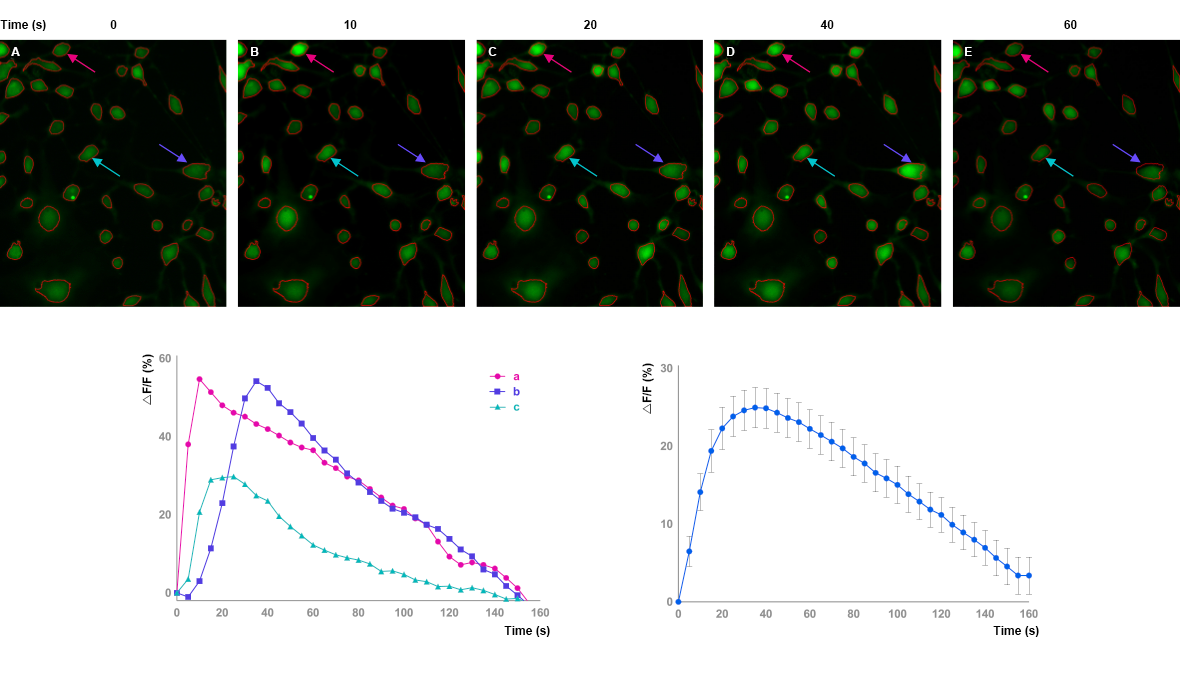
Figure 1. Time-lapse measuring of ATP-dependent calcium efflux. The represented time-lapse images of Fluo-8® fluorescent signals by calcium mobilization after treatment of 20 µM ATP reagent (A-E). The changes of the total cell fluorescent signal were plotted in (F), and the three instance cells have individually plotted the changes of calcium flux by the ATP ageists. The color-coordinated arrows were represented on the plot (G) based on the images (A-E).
CONCLUSION
In the presence of ATP, intracellular calcium ion was instantly augmented and then gradually returned to baseline levels over 2-3 minutes from the intensity of the total fluorescent. In the color coordinated three cases, the individual cells may not correctly synchronize their intensity on the 35s but scuttled between 15s to 45s. Thus, the results based on the measurement of the intensity over 3 minutes represented the calcium values of changes over time and peak heights in 10-40 second within 180 seconds [9]. Since the reaction occurs in such a short time, delivering the agonist stimulator to wells should be synchronized among the wells by using multi-channel pipet. The calcium flux assay with Fluo-8® AM was perceived as the green fluorescence as the intensity at Ex/Em = 490/525. The [calcium flux measurement] pipeline was built in CELENA® X Analyzer and applicable to measure total fluorescent and to trace specific cells’ intensity out of the multiple sequential images of either z-stack or time-lapse in CELENA® X imaging system of live cell fluorescent measurement.
4KB


