Keywords: Automated cell counter, insect cells, cell counting, viability assessment, dual staining, dye assessment
Protein production systems such as mammalian cells, and insect cells are widely used across life sciences, biotechnology, and biomedical industry. Notably, insect cells like the SF9 cell line are extensively used in protein expression thanks to their following benefits: ease of culture, cost-effective in scale-up processes, and higher tolerance to osmolality compared to mammalian cells. However, ensuring high-quality protein production requires monitoring both cell concentration and viability to maintain healthy cell cultures and robust protein production. The LUNA-FX7™ automated cell counter can provide a convenient technique for this purpose when paired with appropriate staining methods. This study aims to recommend the optimal dyes for assessing the viability of SF9 cells after comparing different viability stains.
SF9 cells were stained with Trypan Blue Stain, 0.4% (T13001), Acridine Orange (AO)/Propidium Iodide (PI) Stain (F23001) and Fluorescein Diacetate (FDA) / Propidium Iodide (PI) Stain (F23214).
Trypan blue staining
1. Mix:
• 10 μL TB, 0.4%
• 10 μL cell sample
2. Load 10 μL of stained cells.
3. Perform analysis using the LUNA-FX7™.
*Default protocol
Fluorescence staining
1. Mix:
• 2 μL pre-mixed dyes or 1μL per individual dye
• 18 μL cell sample
2. Load 10 μL of stained cells.
3. Perform analysis using the LUNA-FX7™.
*Note: SF9 cells may express varying fluorescent intensities based on dyes used. Please make adjustments as needed.
We have selected four commonly used dyes for viability assessment:
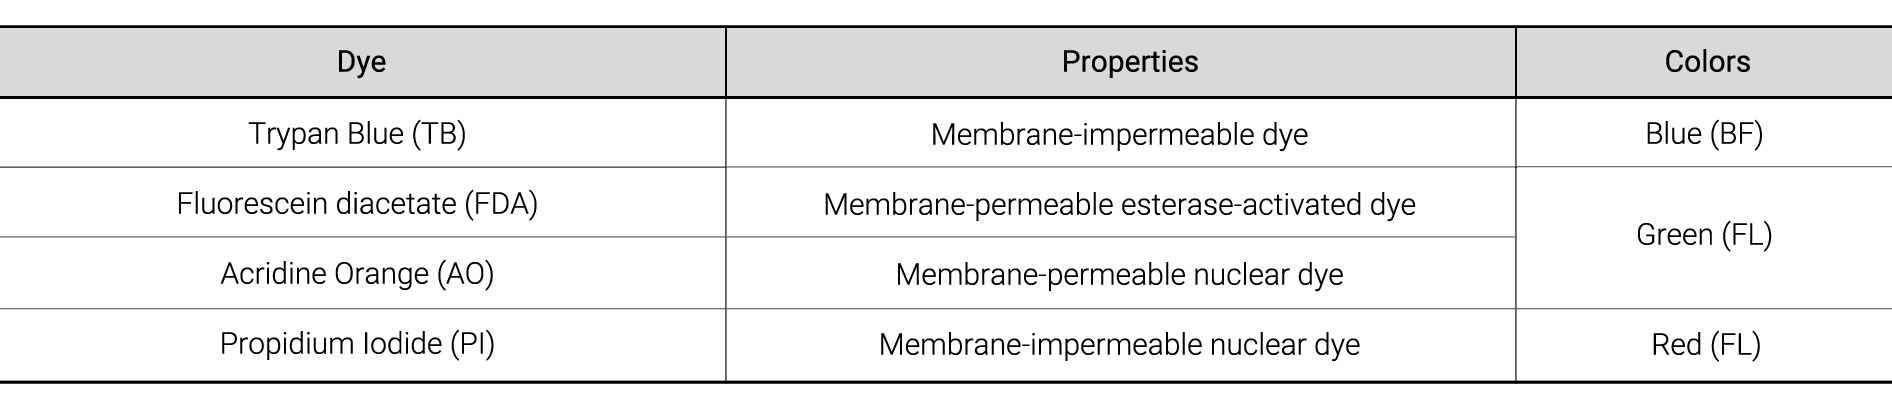
Summary: Both TB and FDA/PI are viable for SF9 cell staining for viability measurement (Figure 1 A), but FDA/PI is the preferred option.
TB is commonly used to assess cell concentration and viability of SF9 cell. However, we recommend avoiding TB with adherent cultures as it requires applying physical manipulations during subculturing. SF9 cells are susceptible to mechanical force and agitation which can introduce cellular debris with adherent cultures. This can result in non-specific binding of TB to various particles in the sample. This issue may be less pronounced in suspension cultures.
In the evaluation of fluorescent dye combinations, U937 cells stained with the AO/PI dye combination used as a reference to validate dye performance. While AO/PI staining is generally effective for most mammalian cells, its efficacy may vary across various cell types. Indeed, SF9 cells stained with the AO/PI dye combination expressed low signal intensity. We speculate that this variation could be caused by the relatively small genome size of insect cells compared to mammalian cells. To overcome this issue, both GF and RF exposure levels were adjusted to 7 compared to the typical exposure level of 5 for mammalian cells. While PI expressed sufficient signal, the signal intensity from AO remained low after adjusting exposure levels. Although all cells were successfully labeled, weak AO signal can compromise overall performance (Figure 1B).
Considering the issues mentioned above, the most effective option for SF9 cell counting and viability assessment was FDA/PI among the options tested. FDA relies on cellular esterase activity, which is effective for various cell types such as yeast and insect cells regardless of genome sizes. FDA can express a high signal in the cell cytosol, which requires lowering GF exposure level to 1. With the appropriate LED levels – GF 1 / RF 7, the FDA/PI dye combination was the most recommended option for assessing SF9 cells.
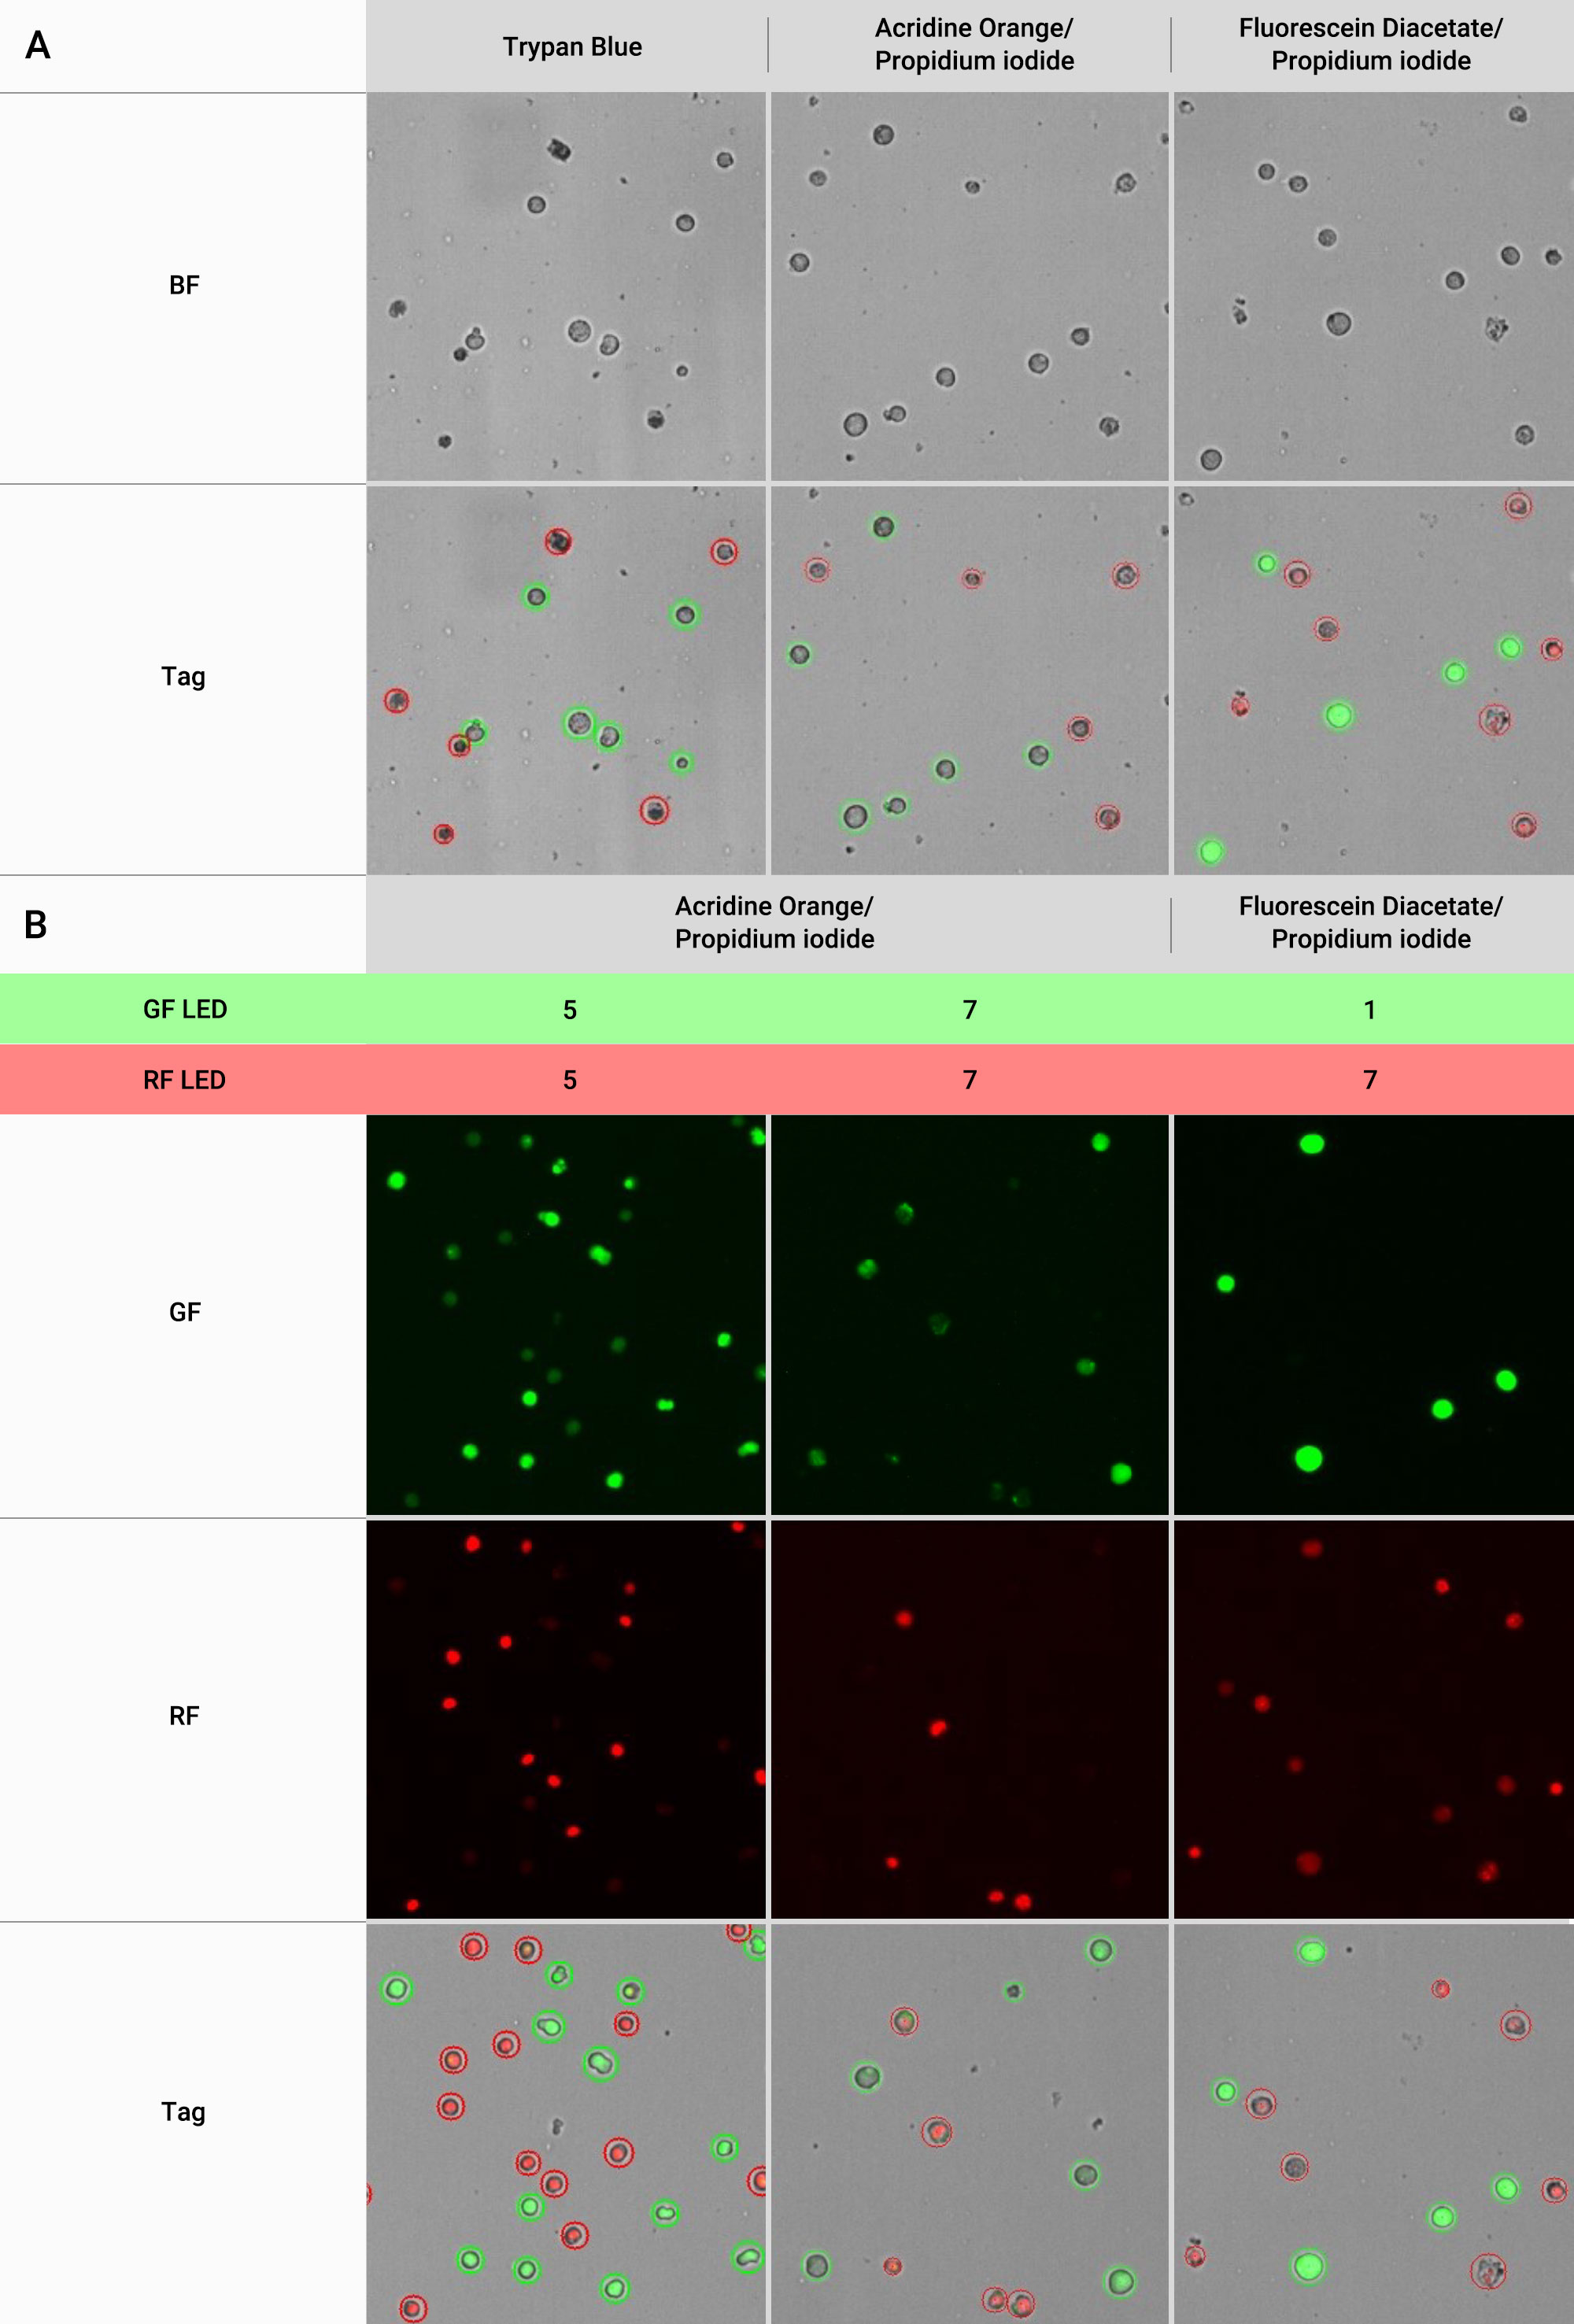
The most recommended choice for SF9 cell viability assessment is FDA/PI due to its consistent performance and compatibility. The LED levels are required to be adjusted to GF 1 / RF 7 when using FDA/PI with SF9 cells, as FDA can generate a high signal and PI signal may be lower compared to when applied to mammalian cells. TB staining is not recommended for SF9 subculturing with adherent cultures, though this issue may be mitigated when using suspension cultures. Moreover, increasing LED exposure levels may partially address the low signals from AO after staining SF9 cells with AO/PI. However, this approach could compromise the overall performance of the LUNA-FX7™ Automated Cell Counter. In summary, choosing the appropriate dyes and optimal exposure level of the LUNA-FX7™ Automated Cell Counter can offer a great method for monitoring SF9 cell quality.


