Keywords
Single-cell sequencing allows researchers to characterize abnormal cell populations, discover and analyze rare cells, cellular map networks, and discover subtle, yet important, heterogeneities. Given the incredible potential, it is not a surprise that single-cell sequencing technology is seeing explosive growth and demand1, 2. Harnessing the power of single-cell sequencing, however, requires significant investment in cost and time. To ensure that the investment in time and resources is rewarded with quality data, the quality of the sample, prior to processing, is critical. Further, because all single-cell sequencing protocols rely on accurately quantifying cells before processing, accurate cell counts are a vital first step.
Therefore, an automated cell counter used to quantify single-cell sequencing samples must accurately and reliably count cells of all sample types, including dissociated tissues, separated nuclei, whole blood, and cultured cell lines. Here, we demonstrate how the LUNA-FX7™ Automated Cell Counter provides not only accurate counts for many diverse sample types but also just as importantly, verification of sample quality.
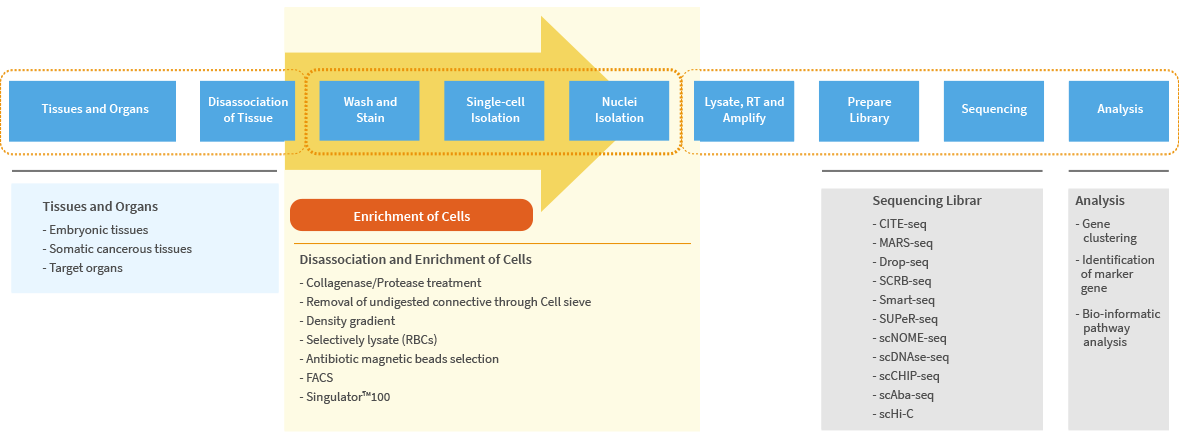
Figure 1. Singe-cell sequencing workflow: 1) Tissue Collection, 2) Isolated Cell Preparation, 3) Sequencing Library Preparation, 4) Sequencing and 5) Analysis.
Initially, two cell samples were collected for single-cell RNA-seq analysis.Both samples were counted using standard cell viability protocol with the Acridian Orange / Propidium Iodide cell staining dye (Cat# F23001 ). The first sample, B cells isolated from human peripheral blood, a high degree of viability and single-cell separation (Figure 2) suitable for downstream library preparation. By contrast, the second sample, adherent AsPC-1 cells, provides an example of how an accurate image-based counter is vital to assessing the quantity and quality of the sample preparation.
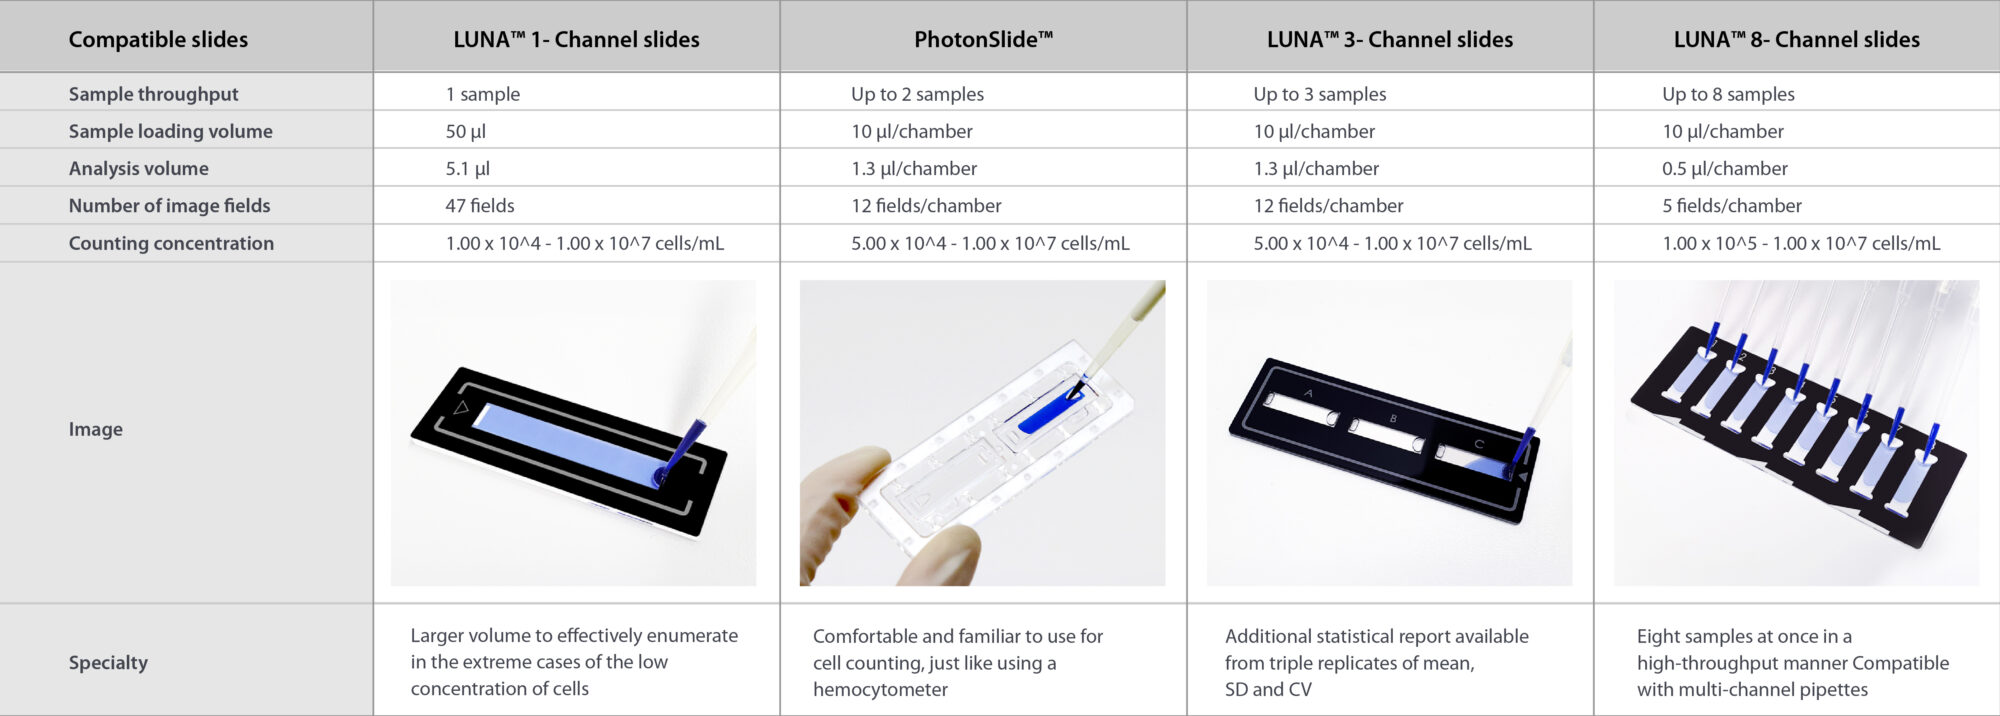
After harvesting, the AsPC-1 cells were subject to an incomplete dissociation. The resulting image clearly shows that a significant portion of the cell content is still incorporated into bound clusters as much as 9 %, and the AsPC-1 viability was only 56 %. Subject to the viability and cell separation, this sample is not suitable for downstream processing (Figure 3). In many cases, the sample cells for single cells are limited and require low cell concentrations and replications of count for the best and rapid cell counting. In the accurate count of low cell concentration, we use the LUNA™ 1-Channel Slide (Cat# L72011), which holds a larger cell volume to count even the cell concentration is low to 1.00 x 10^4 cells/mL (Table 1).
For several single-cell sequencing applications, isolated cells need to be further processed to generate separated and intact nuclei. We next evaluated the utility of the LUNA-FX7™ to assess the overall quality and quantity of the fully separated nuclei. For this, we used 3 cell lines – HL60, HeLa cells, and HEK cells. Figure 4 shows 3-panel images containing intact, healthy HL60 cells (left), HL60 cells with the nuclei partially isolated (middle), and the nucleic completely separated (right), and the live cells with intact cell membranes appear green fluorescence by Acridian Orange staining. In contrast, both dead cells and isolated nuclei turn red fluorescence by Propidium Iodide uptaken through broken or absent cell membranes. However, the LUNA-FX7™ allows you to distinguish intact dead cells vs. intact nuclei using the cell size information (Figure 4, Figure 6). For example, average cell size of intact live HL-60 was measured as 13.4 μm, and the average size of the completely isolated nuclei was measured as 8.3 μm, indicating cell membrane and plasma part was successfully removed. Incompletely isolated nuclei size was measured as 10.2 μm in average indicating the quality of isolated nuclei is not good enough for downstream processing (Figure 4).
Also, high resolution brightfield images of the LUNA-FX7™ can be used to visually verify the quality of isolated nuclei. The isolated nuclei, for instance, can be easily distinguished from intact cells because the borders of nuclei are thinner and not evident due to the lack of the cell membrane. (Figure 5, and Figure 6).
In summary, the LUNA-FX7™‘s capabilities and sensitivity in three-channel imaging (BF, GF, and RF), along with a sophisticated tagging algorithm, allow you to establish quality control criteria for sample pass or fail before committing expensive downstream processing.
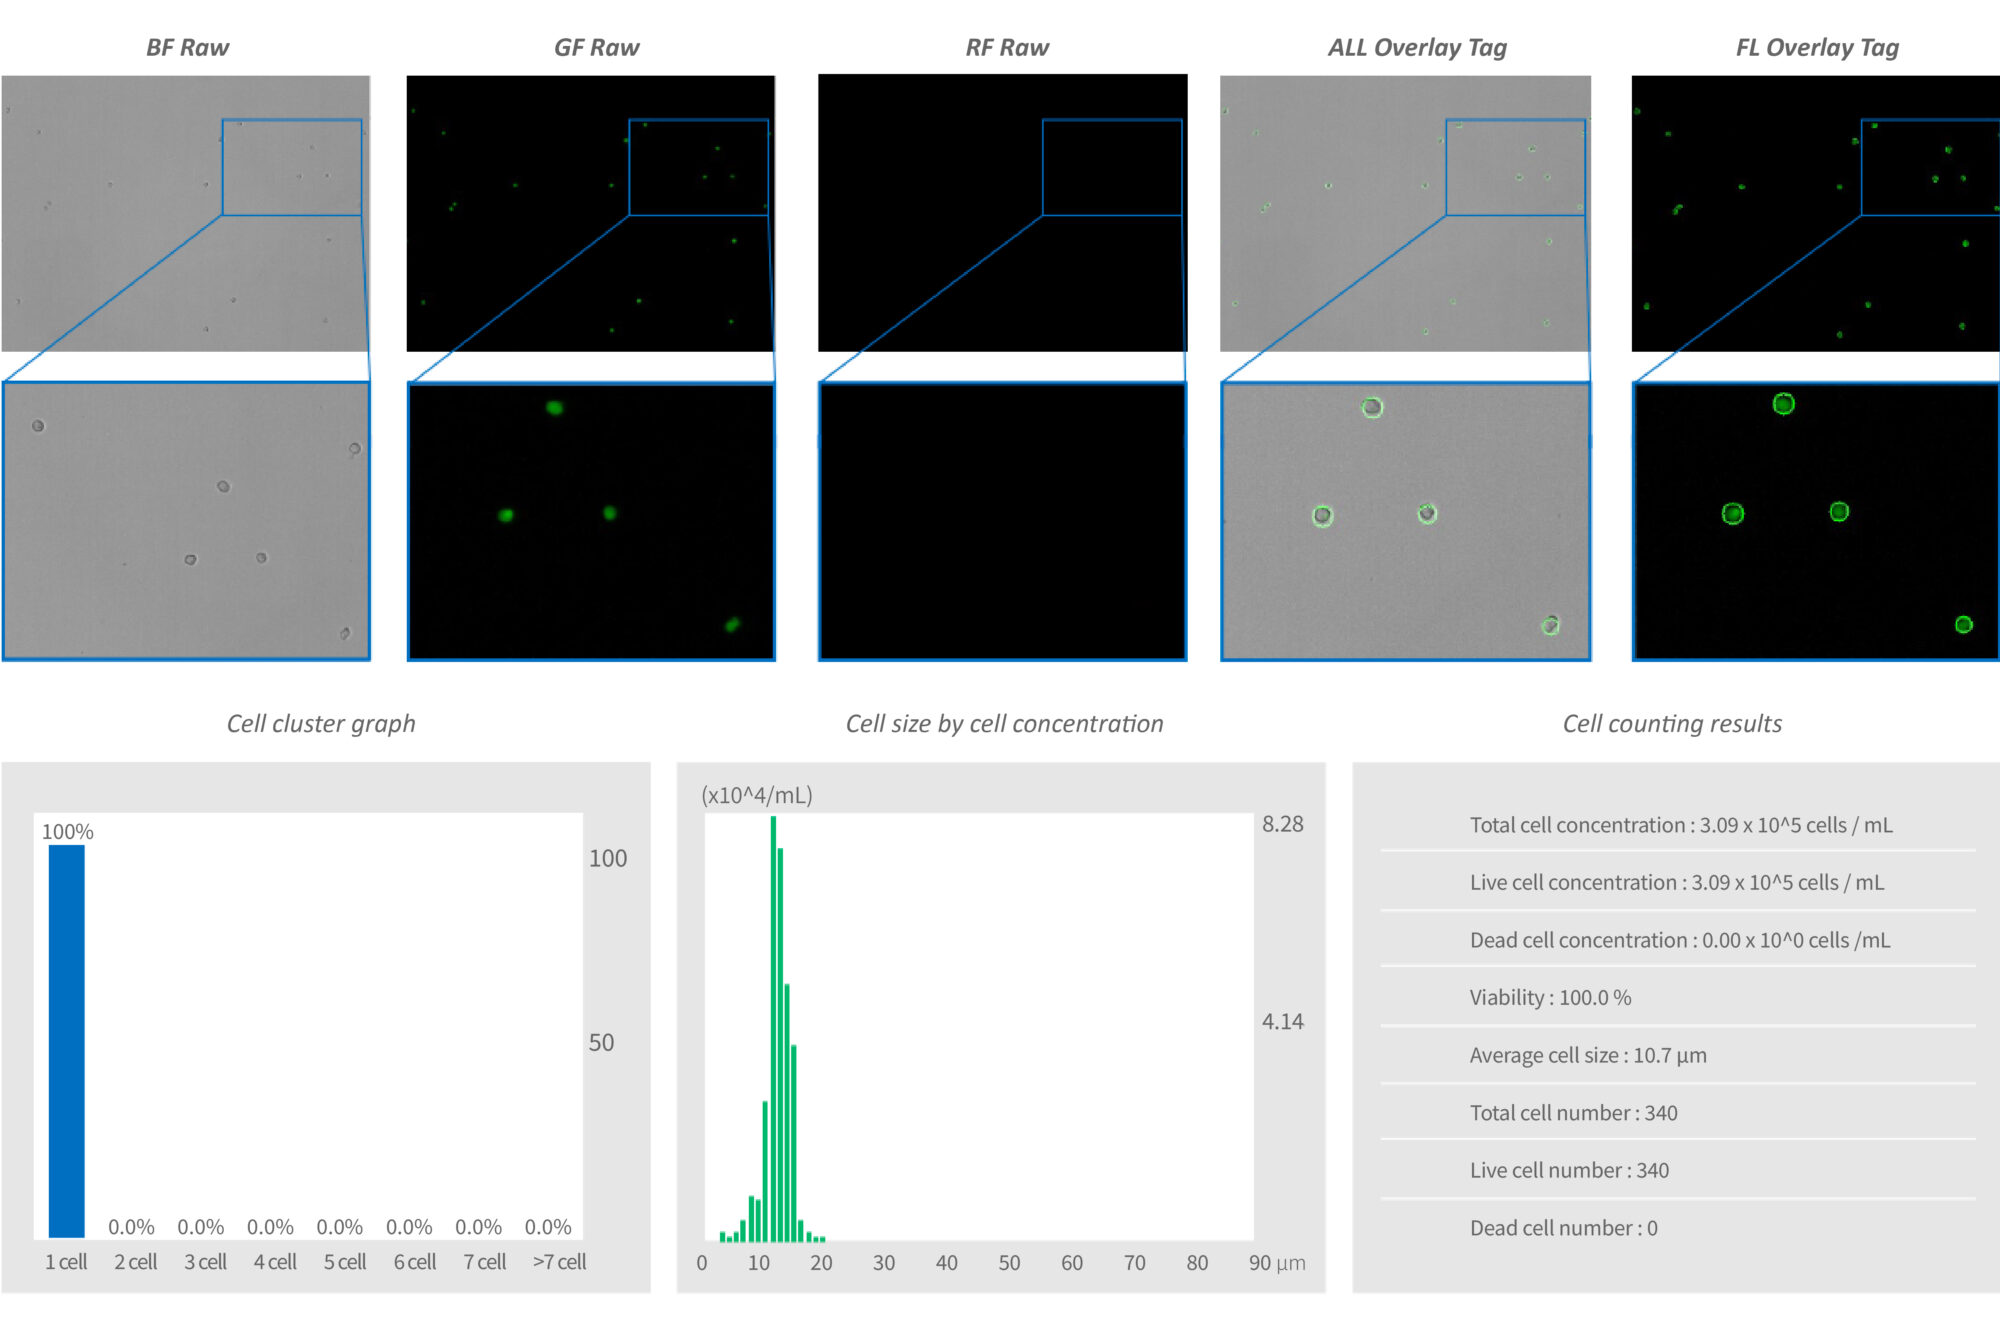
Figure 2. The B cells appeared well prepared for the single-cell library, including all positive green cells without dead cells (RF) or debris of particles (BF) with an excellent tag of 100 % viability. These healthy cells demonstrated an average cell size of 10.7 µm, 100 % single-cell separation in the cell cluster plot at a concentration of 3.00 x 10^5 cells/mL as cell counting
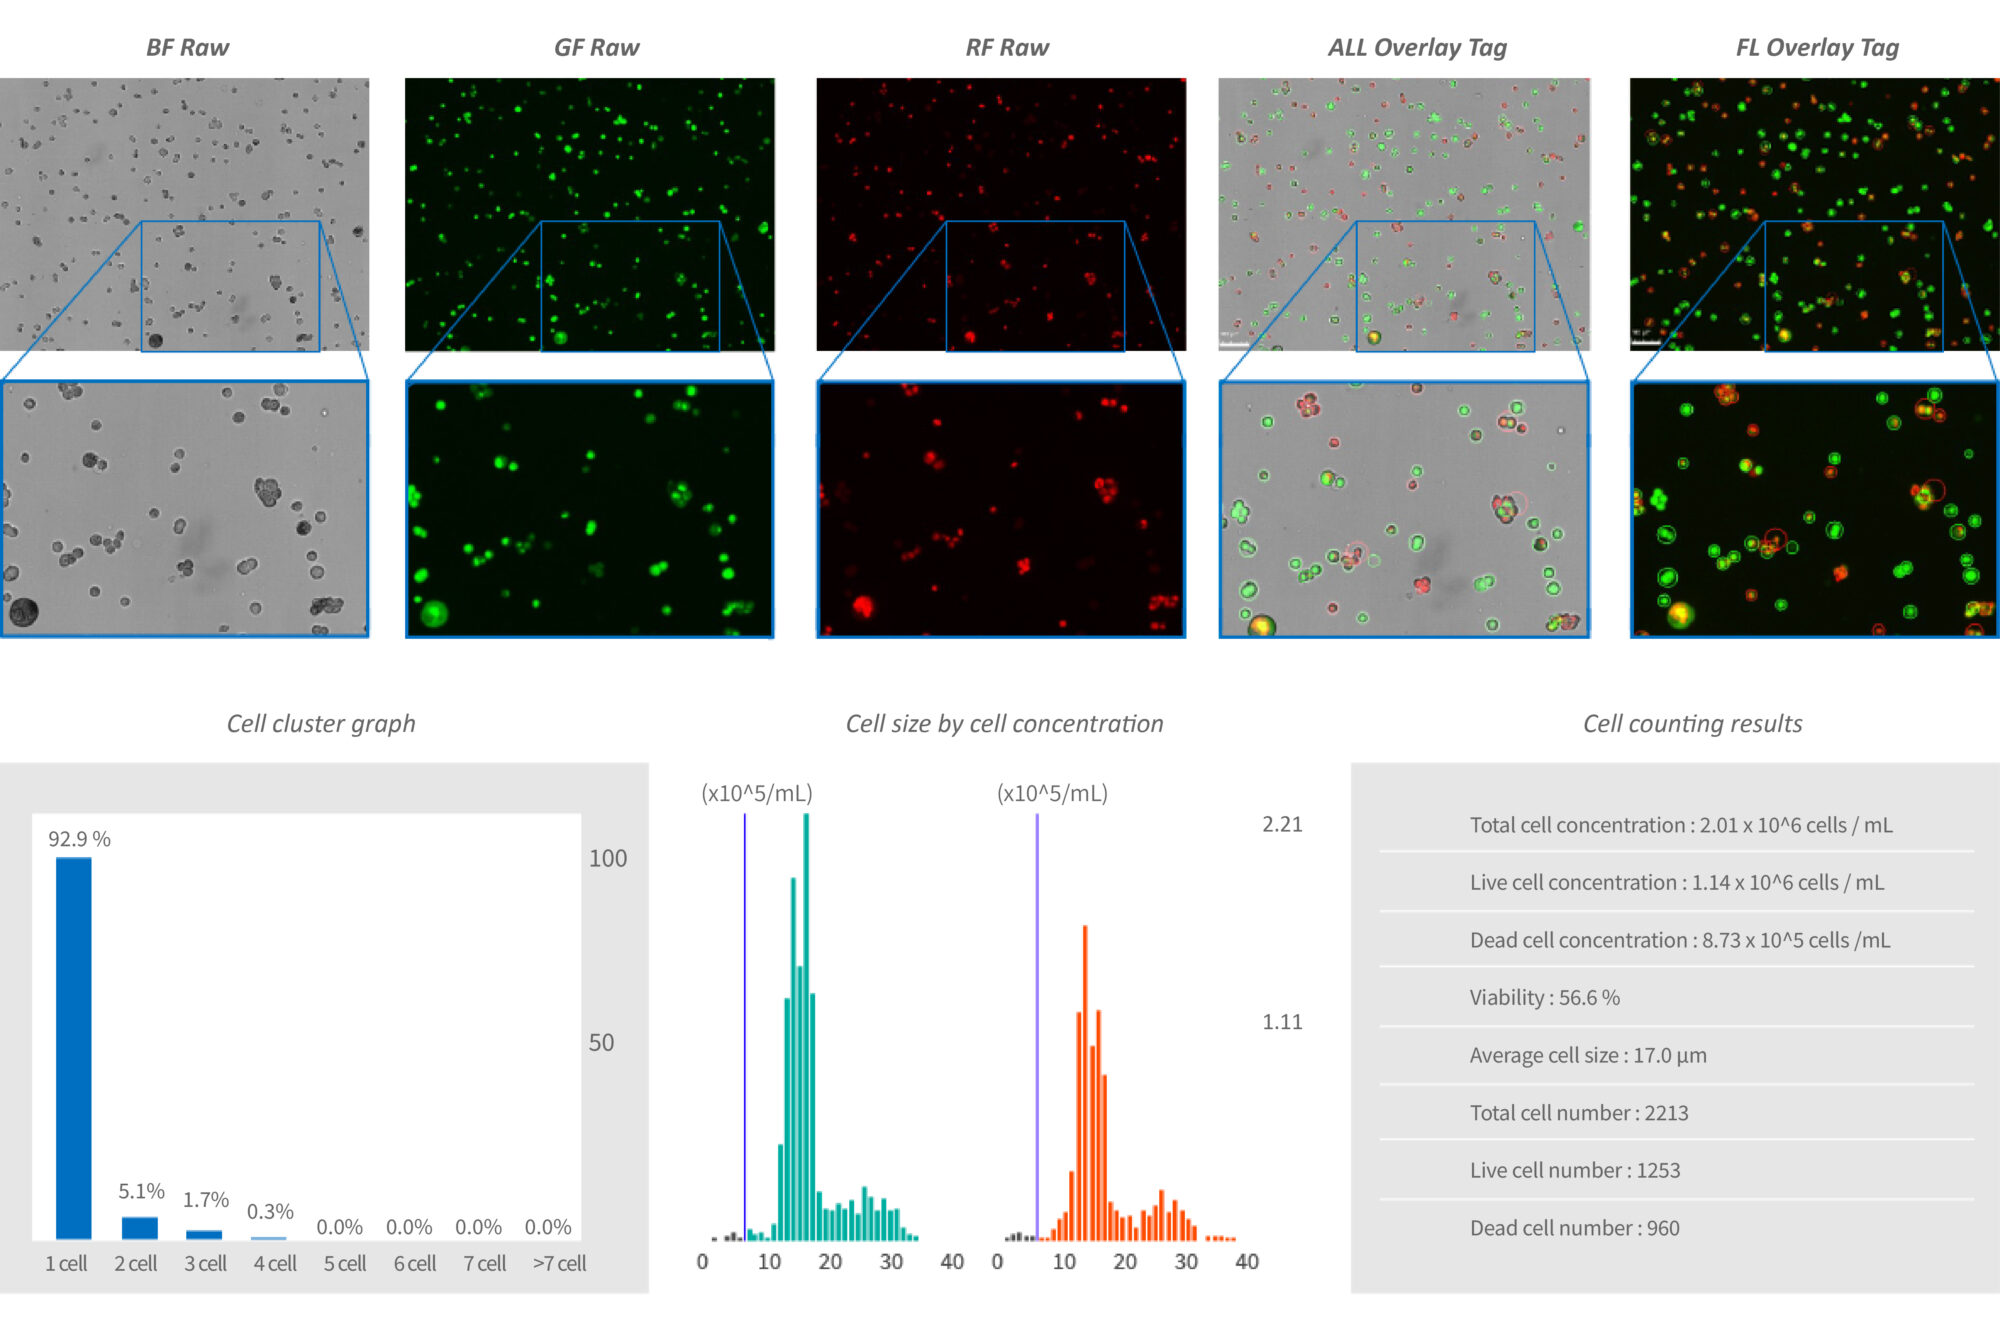
Figure 3. Example of inadequately prepped cell sample for single-cell sequencing. The AsPC-1 cells of inadequate cell profiles for single-cell sequences have been described. ‘Failing’ cell preps show both a high content of dead cells and contain incompletely dissociated clusters of cells. The cluster histogram feature of the LUNA-FX7™ allows the accurate assessment of cell cluster percentages vs. isolated cells.
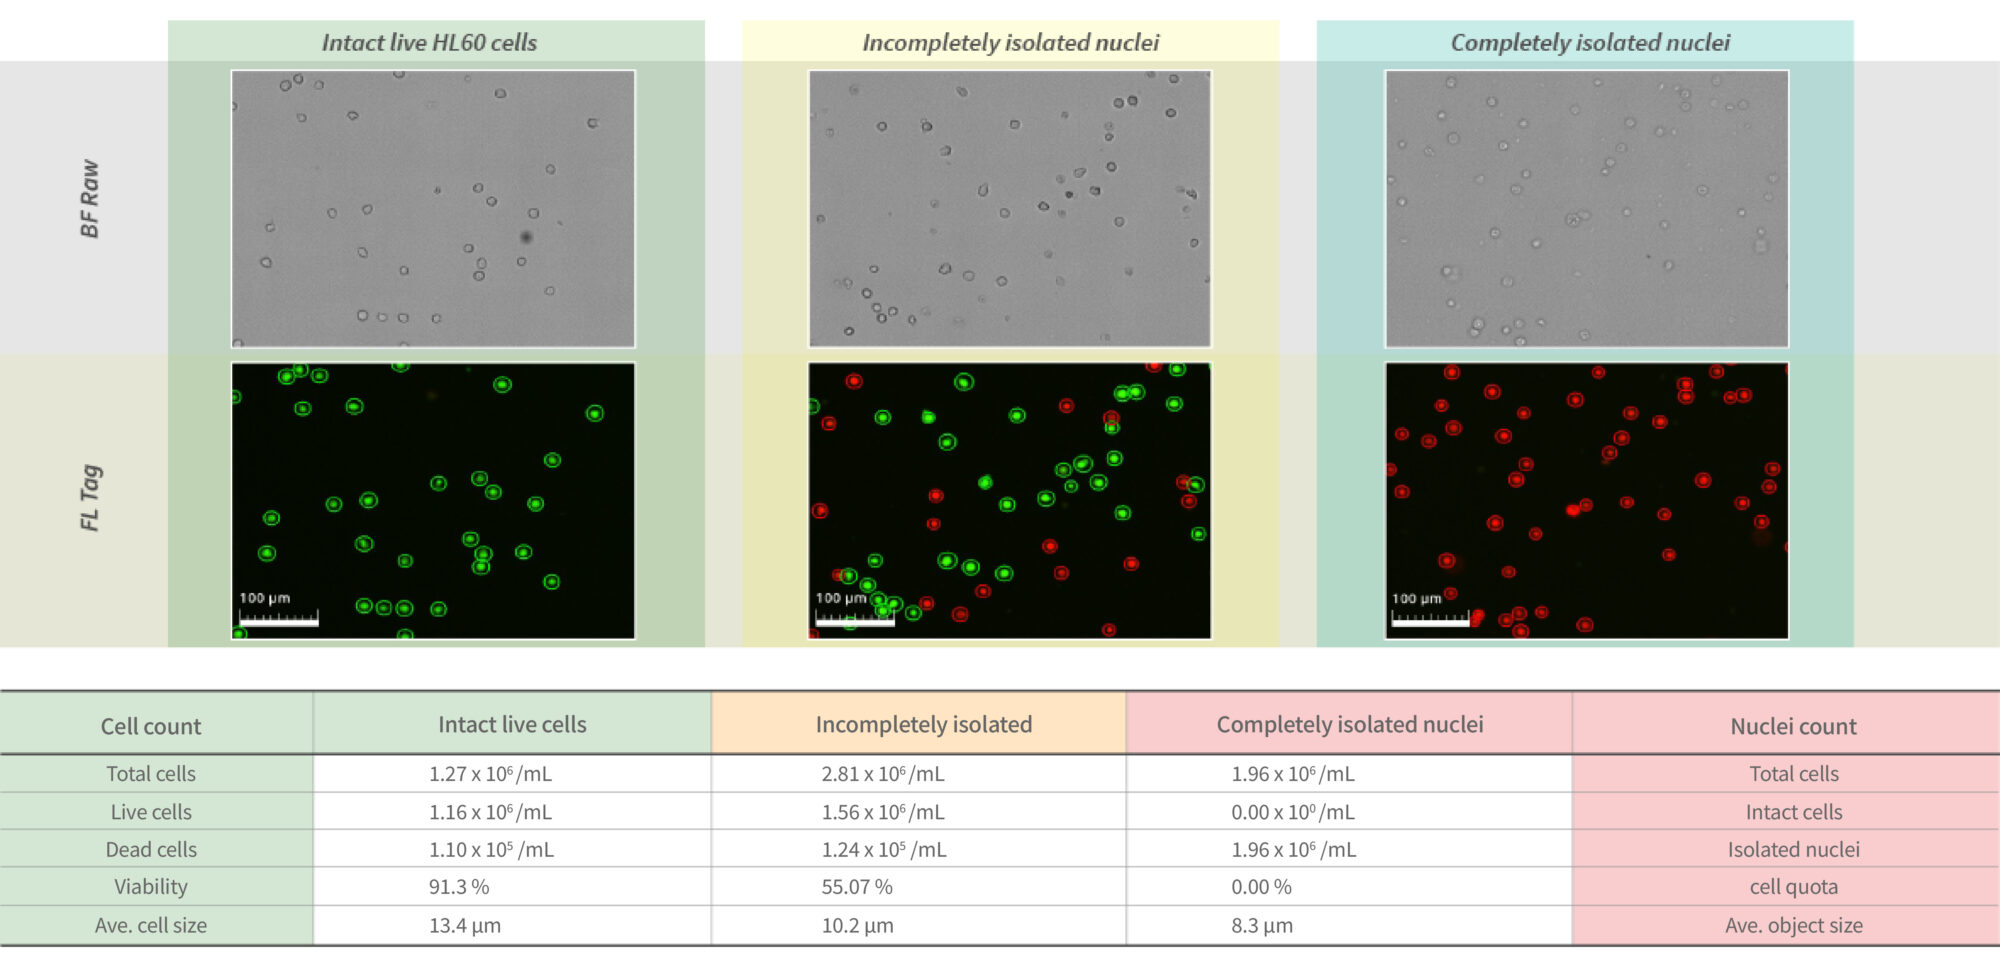
Figure 4. Possible results from nuclei isolation processes of HL 60 cells. Brightfield (BF) images and overlaid fluorescence images with tag allow you to distinguish the different cell ‘states easily’. Intact cells appear noticeably more prominent and darker than the isolated nuclei in BF images. At the same time, the fluorescent images and counts allow accurate quantitative assessment.
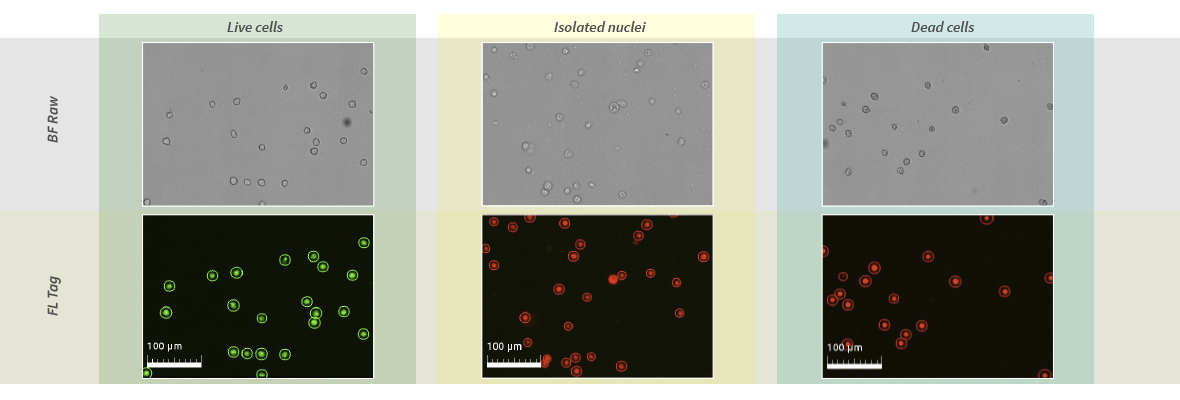
Figure 5. Differentiation between live, dead, and intact nuclei. Because both dead cells and intact nuclei lack an intact cell membrane, the red fluorescent would be perceived from propidium iodide staining. However, the BF images and size measurements generated by the LUNA-FX7™ enable the routinely distinguish between dead cells and intact, isolated nuclei.
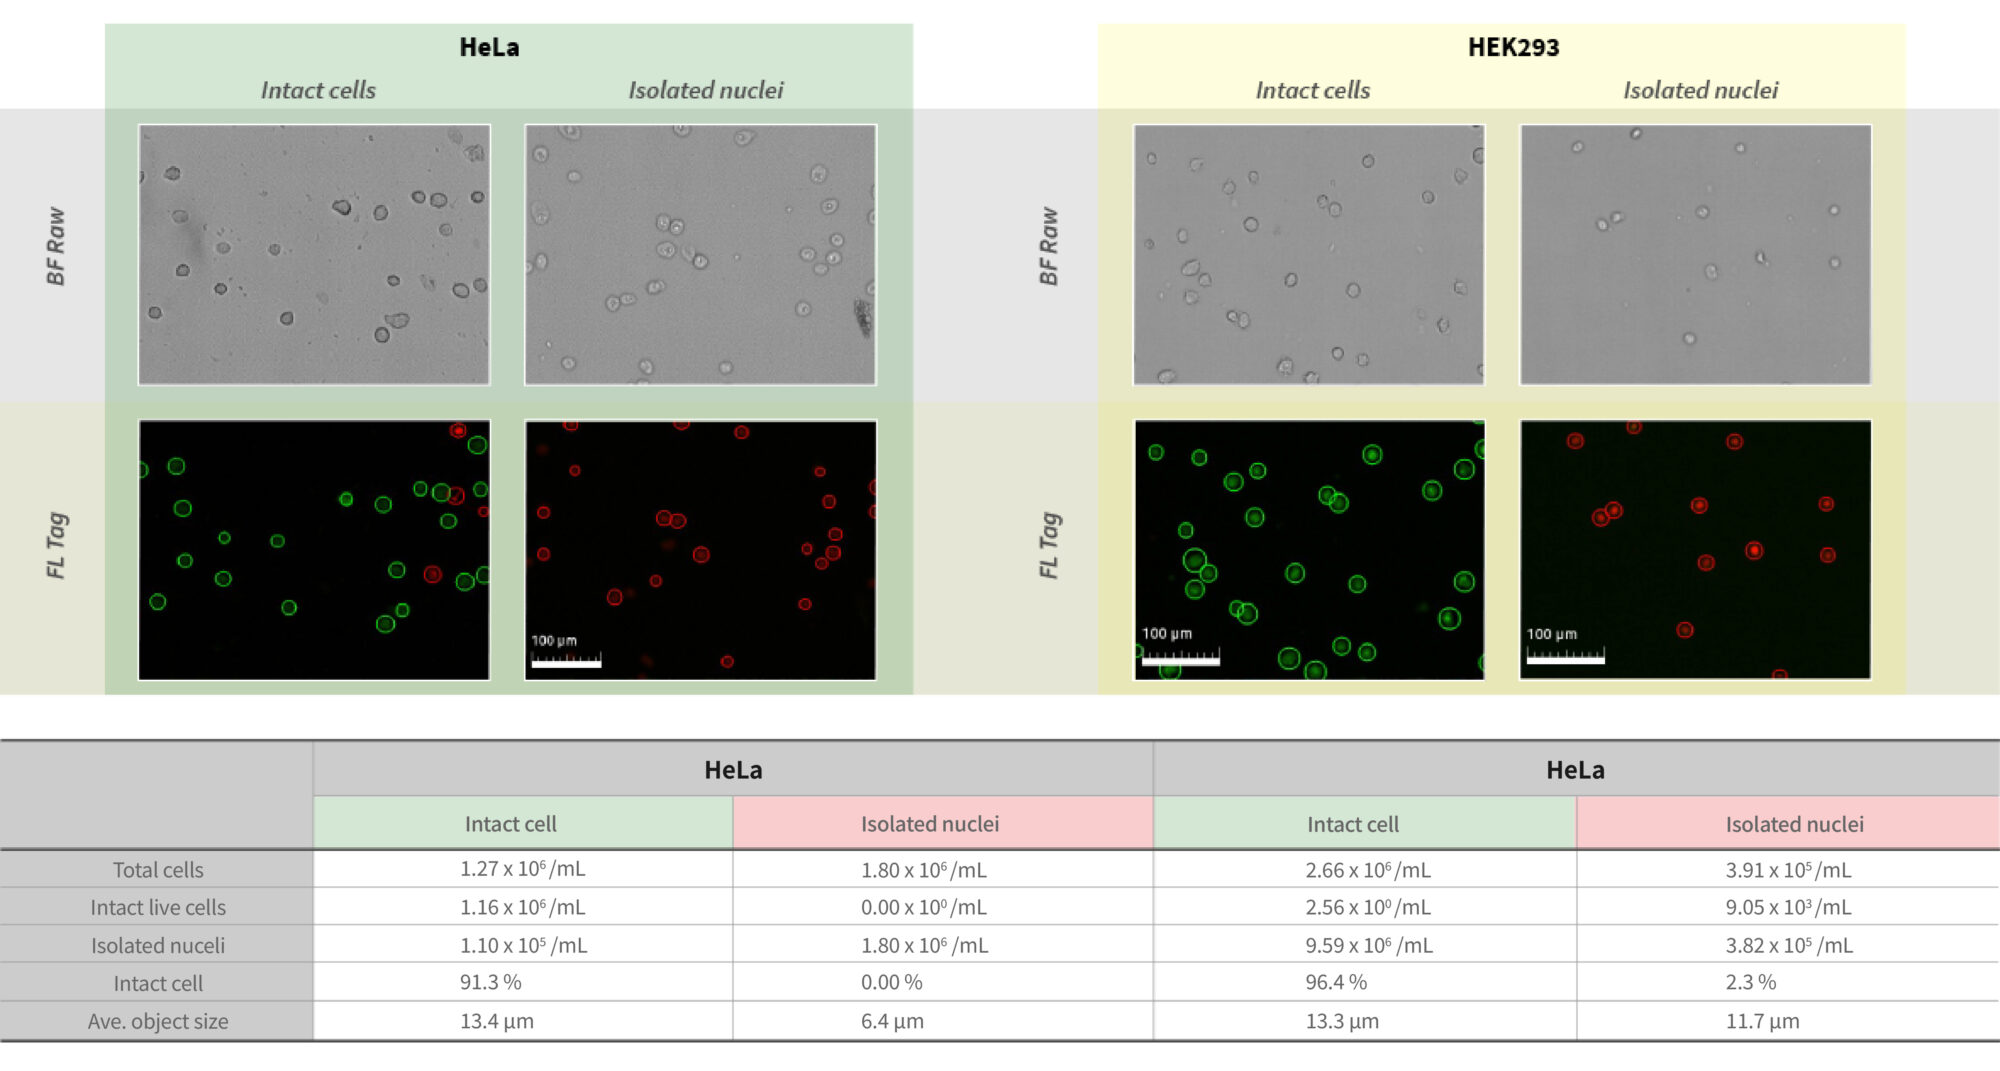
Figure 6. Evaluation of isolated nuclei and possible results. Brightfield (BF) images and overlaid fluorescence images allow you to distinguish the different cell ‘states easily’. Intact cells appear noticeably more prominent and darker borders than the isolated nuclei in BF images. At the same time, the fluorescent images and counts allow accurate quantitative assessment. Live intact cells are stained with acridine orange (GF), and separated nuclei are stained red. The LUNA-FX7™ can accurately discriminate from samples with large cytoplasm and small nuclei (HeLa) and cell types with large nuclei relative to the cytoplasm (HEK293).
Table 1. The counting slide options and their specifications.
For single-cell sequencing, theLUNA-FX7™ provides insight for researchers exploring to improve cell sample accuracy and reliability to assess both the quantity and quality of cells and isolated nuclei samples in a wide range of sample types.
REFERENCES
1 L., Xiong, F., Wang, Y., Zhang, S., Gong, Z., Li, X., . . . Guo, C. (2021). What are the applications of single-cell RNA sequencing in cancer research: a systematic review. J Exp Clin Cancer Res, 40(1), 163. doi:10.1186/s13046-021-01955-1
2 Dong, X., Liu, C., & Dozmorov, M. (2021). Review of multi-omics data resources and integrative analysis for human brain disorders. Brief Funct Genomics. doi:10.1093/bfgp/elab024


