Keywords: Automated cell counter, protoplast isolation, protoplast viability assessment, dual staining, dye assessment
Protoplasts are plant cells with removed cell walls through enzymatic or mechanical removal of the cell wall. These spherical, cell-wall-free plant cells exhibit unique characteristics, including totipotency, making them versatile tools in plant science. They serve as an experimental system that allows to explore the structure, chemistry, and function of plant cells.
Traditionally, viability assessment involved culturing protoplasts until they developed into complete plants, but this method could not provide immediate viability assessment. The LUNA-FX7™ Automated Cell Counter now enables rapid viability determination through double staining with distinct-colored fluorescent dyes. However, it is essential to understand how the LUNA-FX7™ Automated Cell Counter performs with different dyes and to adjust analysis parameters accordingly. This study aims to identify optimal dye combinations and parameters for assessing protoplast viability using the LUNA-FX7™ Automated Cell Counter.
Protoplast Isolation
1. Prepare 5 g of seedlings and wash them once with ethanol and twice with distilled water (DW).
2. Gently pat dry the seedlings with a paper towel and place them in a Petri dish. Use scissors to finely chop them.
3. Add 25 ml of digestion buffer to the finely chopped seedlings, mix well, and transfer to a 50 ml tube. Cover with foil to protect from light.
4. Incubate on a rotator at 20 rpm for 6 hours.
5. After incubation, add 20 ml of wash buffer to the tube, gently mix, and filter through a 100 μm strainer.
6. Centrifuge at 100 g for 3 minutes.
7. Remove the supernatant, add 20 ml of wash buffer to the tube, gently mix, and filter through a 40 μm strainer.
8. Centrifuge at 100 g for 3 minutes.
9. Remove the supernatant and resuspend the pellet in 3 ml of wash buffer.
Fluorescence Staining
1. Mix:
• 18 μL of protoplast cells
• 2 μL of dyes prepared by mixing green and red fluorescent dyes
2. Load 10 μL of stained cells.
3. Perform analysis using the LUNA-FX7™.
*Note: Protoplasts have diverse sizes and may exhibit varying fluorescent intensities. Please make adjustments as needed.
Table 1. The optimize parameter settings for SCC in Fluorescence Cell Counting mode of the LUNA-FX7™
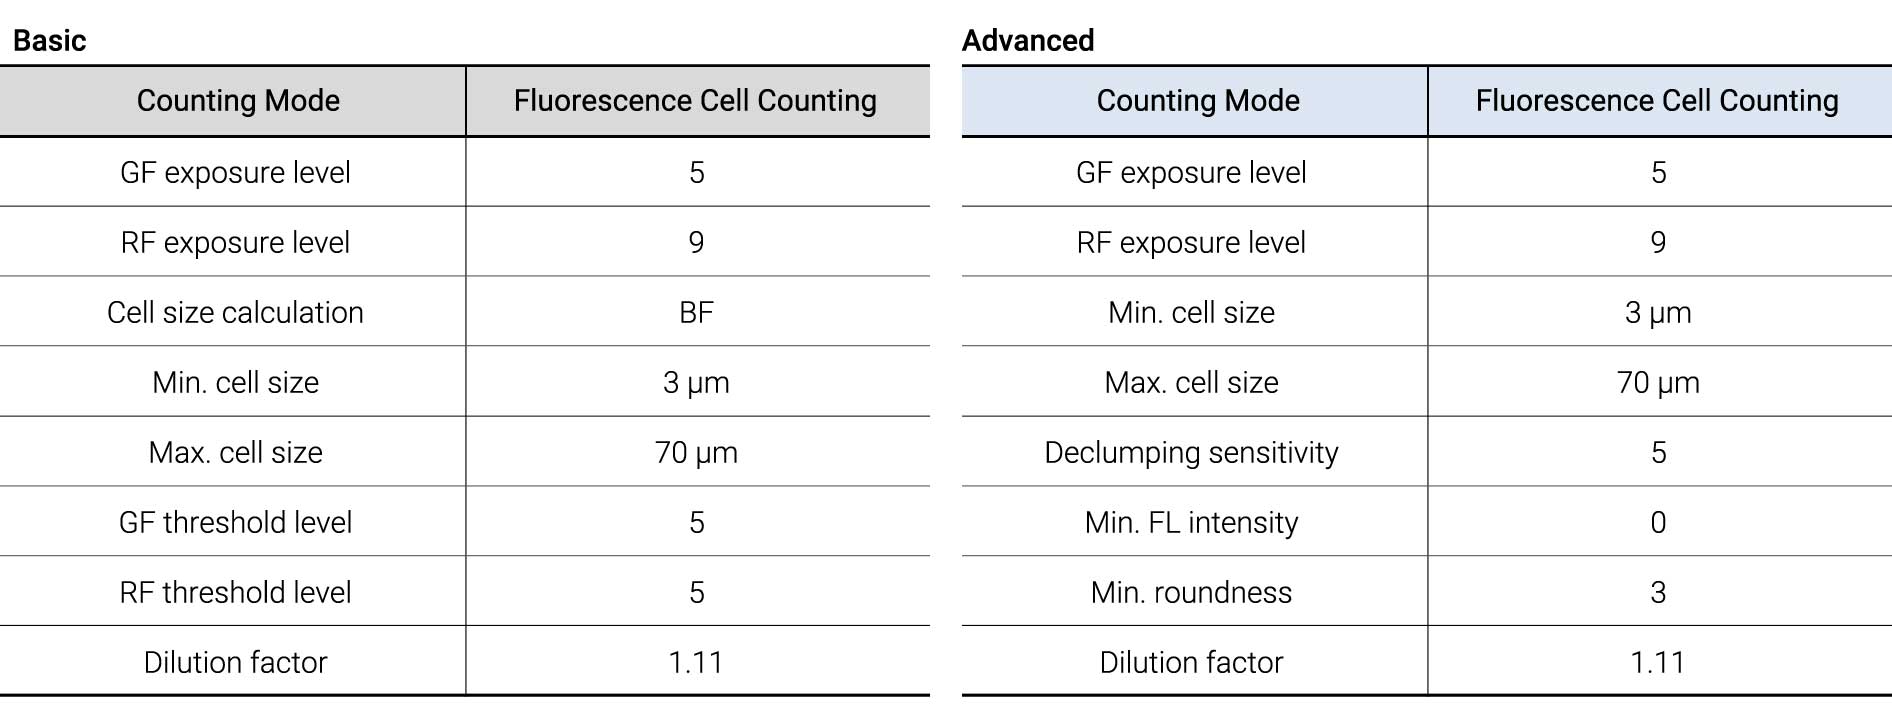
We have selected five commonly used fluorescent dyes for viability assessment:
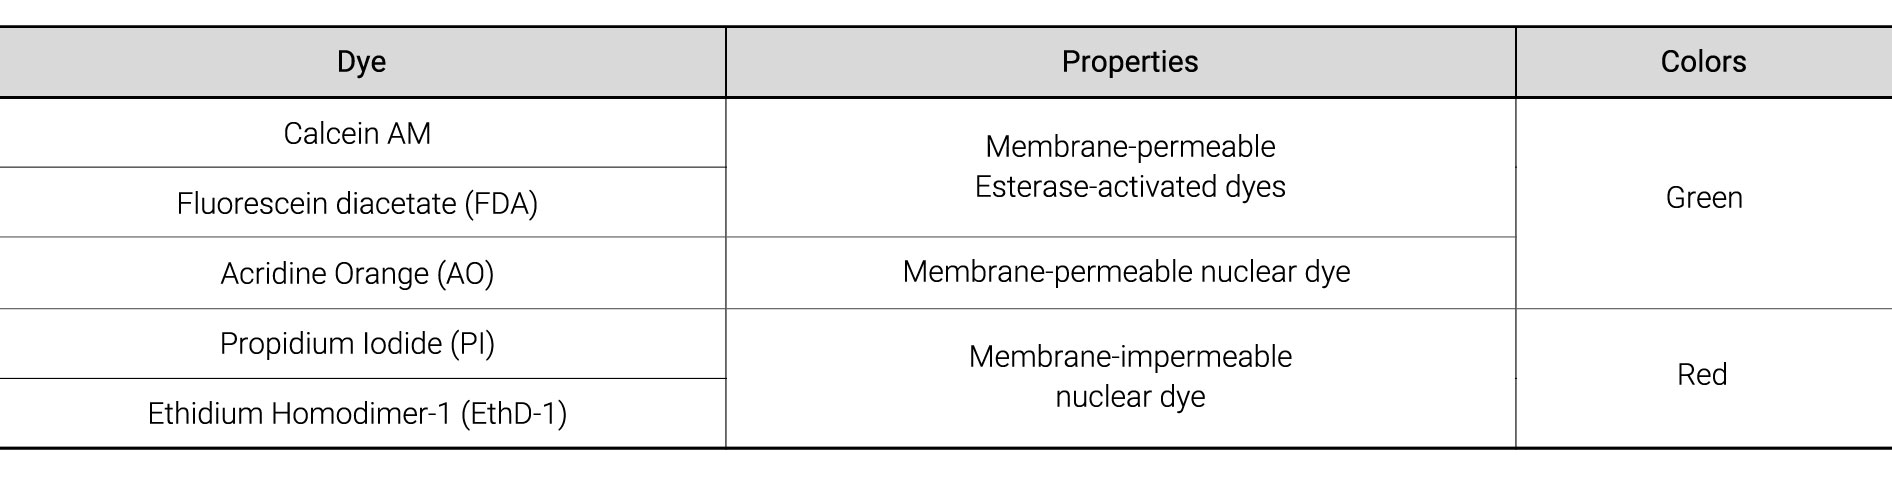
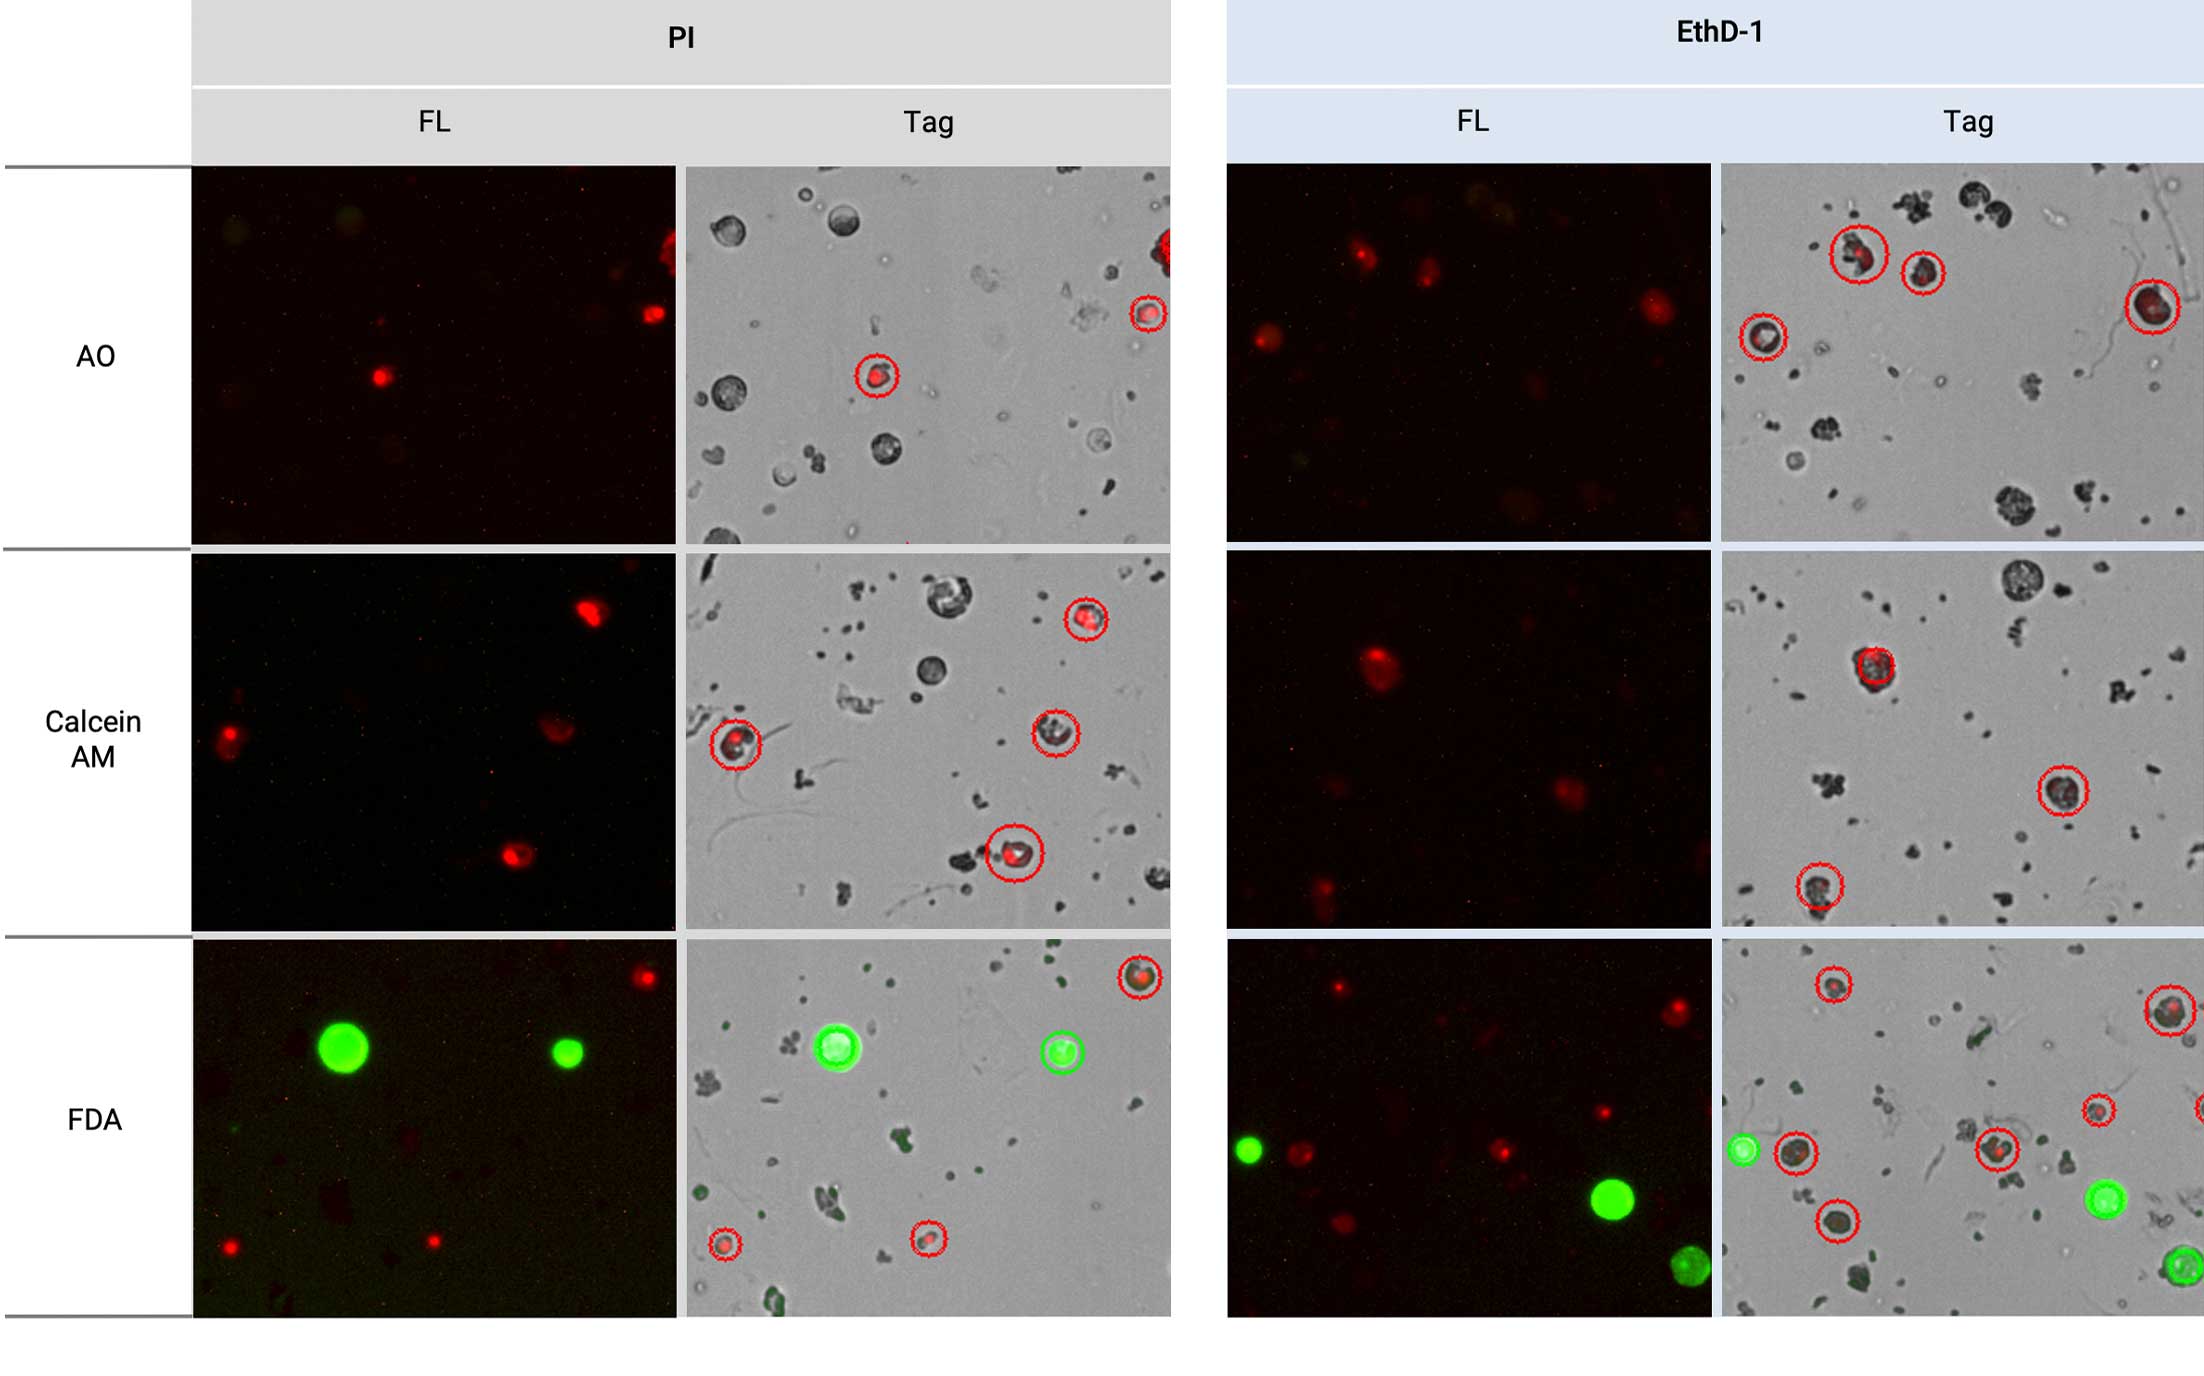
FDA/PI or FDA/EthD-1 is the most effective choice for protoplast viability assessment (Figure 1). Both PI and EthD-1 exhibited the ability to stain protoplast nuclei; however, one may need to adjust the RF exposure level to 9 to detect sufficient signals (Table 1).
Among the green dyes we tested, only FDA yielded a bright and reliable signal with no need of adjusting GF exposure level. Both FDA and Calcein AM rely on esterase activity to produce signals, but Calcein AM exhibited almost no signal. However, it’s important to be aware that FDA can generate high background noise during prolonged incubation periods. We recommend performing cell counting immediately after staining to achieve optimal results in viability assessment. If the signal is excessively high, adjusting the GF exposure level can be applied. Moreover, we found a significant decrease in AO intensity although AO is generally expected to stain all cells.
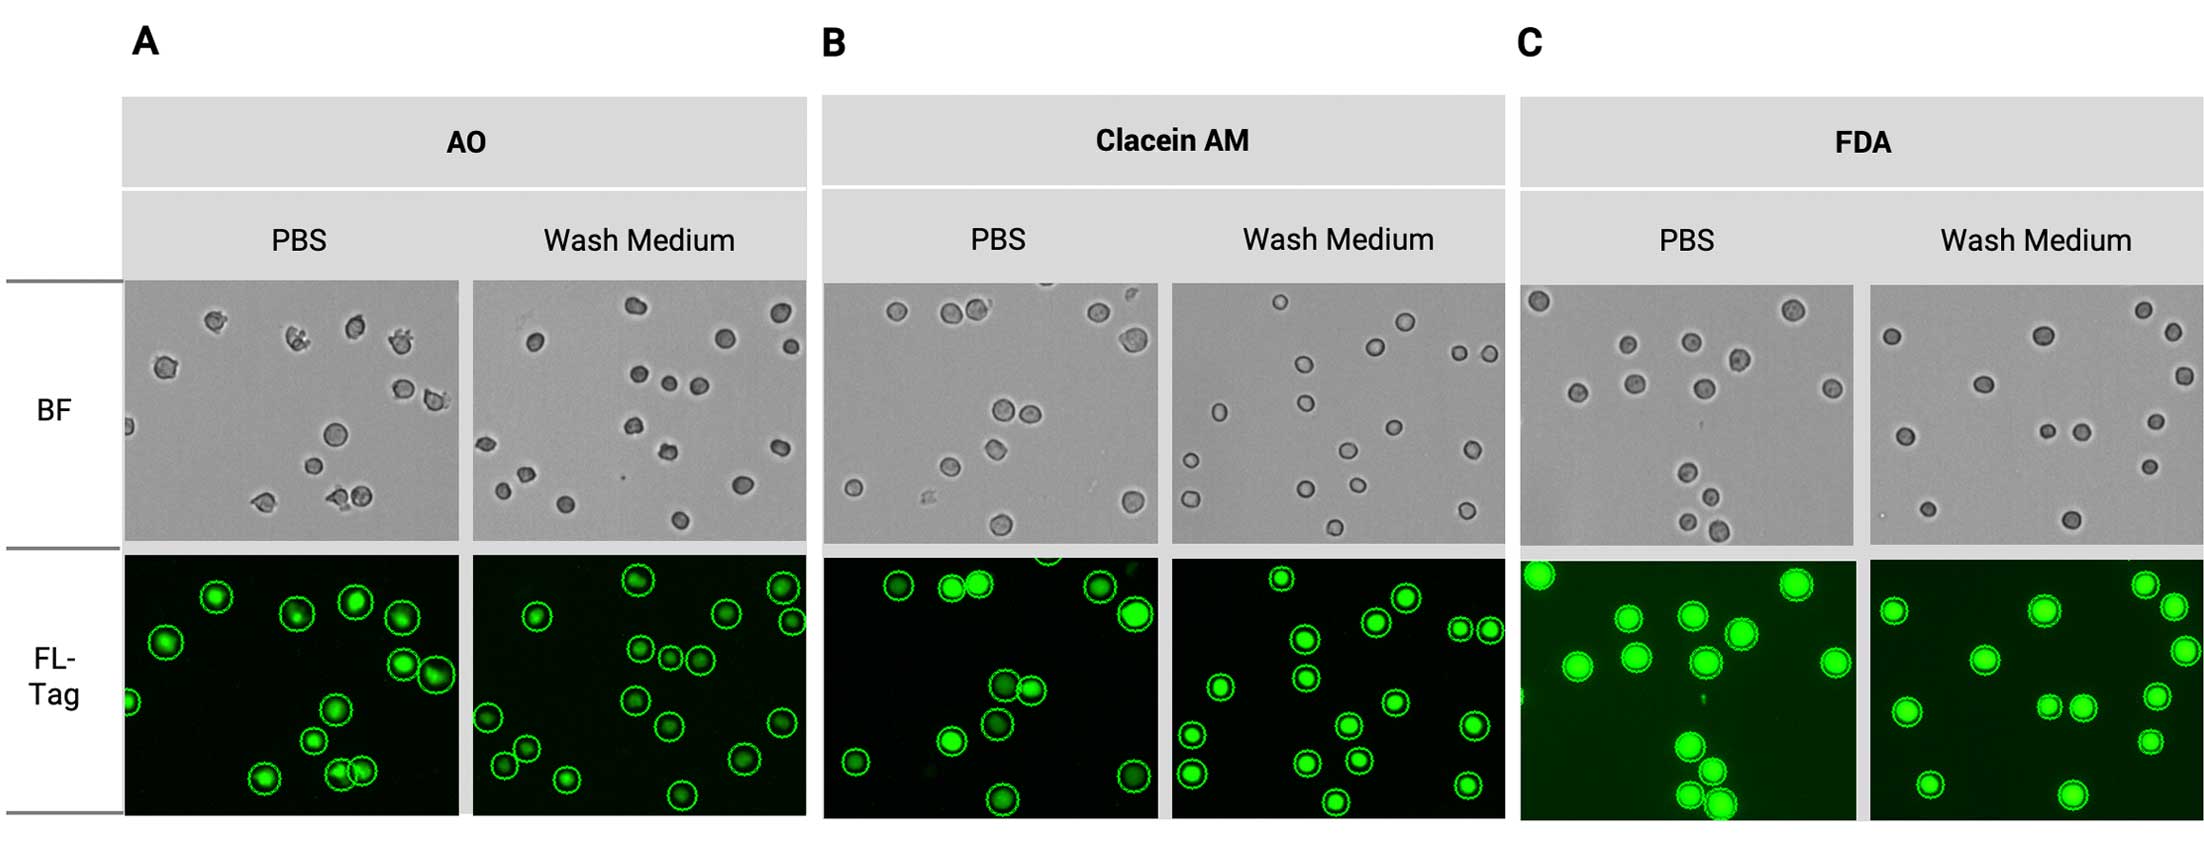
Despite of AO’s known ability to stain all cells regardless of viability, the unexpected low AO signal when used with protoplasts led to further investigation. We conducted experiments using green dyes on mammalian cells, including U937 cells, which are known to be stained by AO. The buffer was changed to either PBS or a wash medium to assess the impact on dye signals, and the default protocol was used for analysis. Indeed, there was a significant reduction in AO signal intensity in the wash medium compared to PBS (Figure 2A). Moreover, Calcein AM exhibited more consistent signals when the washing buffer was used rather than PBS, and FDA showed a minor decrease in overall intensity when the washing buffer was used (Figure 2B and 2C).
Although the precise factors contributing to the differences in dye performance remain unclear, the differences in osmolarity and pH between the wash medium and PBS may influence cells and dye performance. For example, it’s important to note that AO can display varying colors at different pH levels. The difference in osmolarity made a reduction in cell size approximately 13 µm to 1-2 µm smaller. Considering these factors, these dyes can be influenced by diverse mechanisms based on the chemical conditions surrounding the cells.
FDA/PI or FDA/EthD-1 dyes are the most effective dyes that effectively stain protoplasts. While FDA consistently produces a reliable signal, it is important to conduct cell counting immediately to minimize potential background noise during incubation. Calcein AM showed discrepancies in performance depending on the cell types and buffers. Interestingly, the AO signal exhibits a significant reduction when the wash medium is used. Additionally, both PI and EthD-1 are effective in staining protoplasts, but it requires an RF exposure level adjustment from 5 to 9. In summary, choosing the appropriate dye combinations and optimal analysis protocols of the LUNA-FX7™ Automated Cell Counter serve as a great method for protoplast viability assessment.


