High content cytotoxicity assays are in high demand for the cell-based analysis of anticancer drugs. In this study, we demonstrate an automated, multi-parameter assessment of dose-dependent Camptothecin cytotoxicity using the CELENA® X High Content Imaging System. The CELENA® X is a simple solution for the quantitative analysis of cytotoxicity because it can rapidly capture multi-channel fluorescence images from a multi-well plate and the integrated analysis software can accurately analyze multiple cellular parameters.
Cell preparation
To study cytotoxicity in vitro, we treated HeLa cells with different concentrations of Camptothecin (CPT; Sigma-Aldrich, C9911). HeLa cells were counted with the LUNA-II™ Automated Cell Counter, seeded at a density of 1 × 10⁴ HeLa cells/well on a 96-well plate, and cultured overnight. Cells were then treated with serial dilutions of Camptothecin (DMSO, 0.0625 μM, 0.125μM, 0.25 μM, 0.5 μM, 1 μM, 2 μM, 4 μM, 8 μM, 16 μM, 32 μM, 64 μM) at four wells per condition with 95% humidity and 5 % CO2 at 37 °C for 20 hours. To distinguish dead cells, cells were stained with propidium iodide (PI; Logos Biosystems, F23003). To assess total cell numbers, nuclei were counterstained with Hoechst 3342 (Life Technologies, H3570).
Imaging and analysis
Dead and total cells were visualized using the CELENA® X High Content Imaging System. Images were acquired using image-based autofocusing and a 4X LWD high NA objective in combination with filters for Hoechst 33342 (DAPI filter cube: Ex395/25, Em460/50) and propidium iodide (RFP filter cube: Ex530/40, Em605/55). One image field was acquired per well from 48 wells. Acquired images were analyzed using CELENA® X Cell Analyzer software. For quantitative analysis of cytotoxicity, the integrated CELENA® X Cell Analyzer software was used to batch process and analyze images automatically. Two pipelines, Cytotoxicity_DAPI_HeLa_4X and Cytotoxicity_RFP_HeLa_4X, were established to determine the effects of Camptothecin (Table 1). Both pipelines, Cytotoxicity_DAPI_HeLa_4X and Cytotoxicity_RFP_HeLa_4X, employed the IdentifyPrimaryObjects module to identify individual cells based on Hoechst 3342 or propidium iodide staining, respectively. Both used the MeasureImageAreaOccupied module measured the surface area occupied by the fluorescence-stained cells. In the Cytotoxicity_RFP_HeLa_4X pipeline, propidium iodide-stained cells were further analyzed with the MeasureObjectSizeShape module to quantify their size and shape, followed by the MeasureObjectIntensity module to measure propidium iodide signal intensity.
Table 1. Pipelines used to assess transfection efficiency with CELENA® X Cell Analyzer
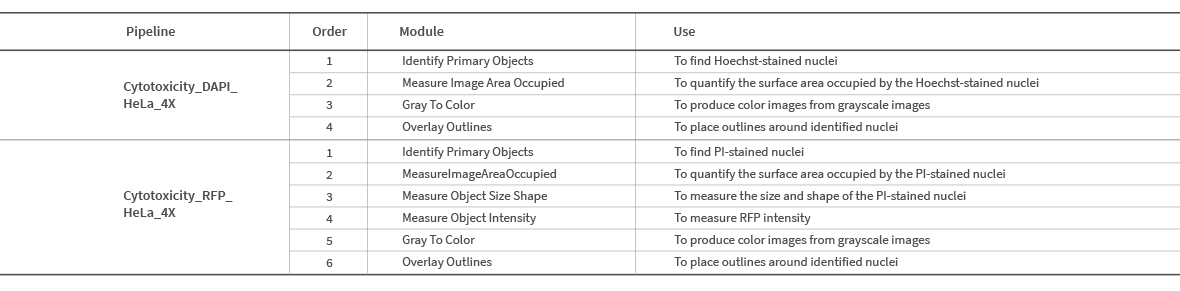
To visualize the data, both pipelines used the GraytoColor module to apply pseudocolor to the grayscale images of each channel and then the OverlayOutlines module to outline the identified cells. GraphPad Prism® software (GraphPad Software, Inc.) was used to plot sigmoidal dose-response curves and calculate IC50 values.
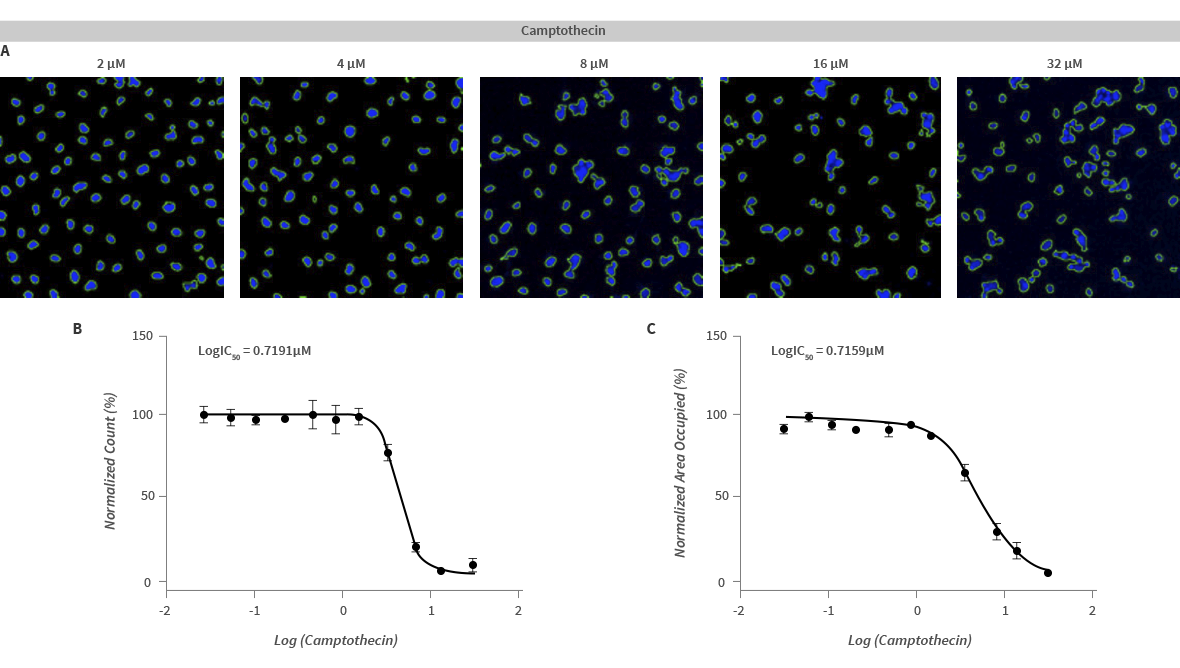
Figure 1. Bioprocessing data output. Images and charts from Hoechst-stained HeLa cells after 20 hours of Camptothecin treatment. (A) Image analysis of Camptothecin-induced cytotoxicity with green borders outlining Hoechst-stained nuclei. Dose-response curves show the cytotoxic effects of Camptothecin on Hoechst-determined (B) cell count and (C) occupied surface area.
Figure 1 showed that higher doses of Camptothecin exposure decreased the number of Hoechst-stained nuclei and the area that they occupied. The IC50 of Camptothecin in relation to these two parameters was 5.2180 μM on average. Figure 2 shows that higher Camptothecin concentrations lead to an increase in clumpy cellular aggregates (Fig. 2A, B), propidium iodide signal size (Fig. 2C), and signal intensity (Fig. 2D). These data demonstrate that cell death leads to the formation of clumpy aggregates caused by the presence of cell debris and free DNA from dead cells. The IC50 of Camptothecin upon assessing these parameters was 4.8591 μM on average. Combined, these results indicate a Camptothecin dose-dependent increase of cell death.
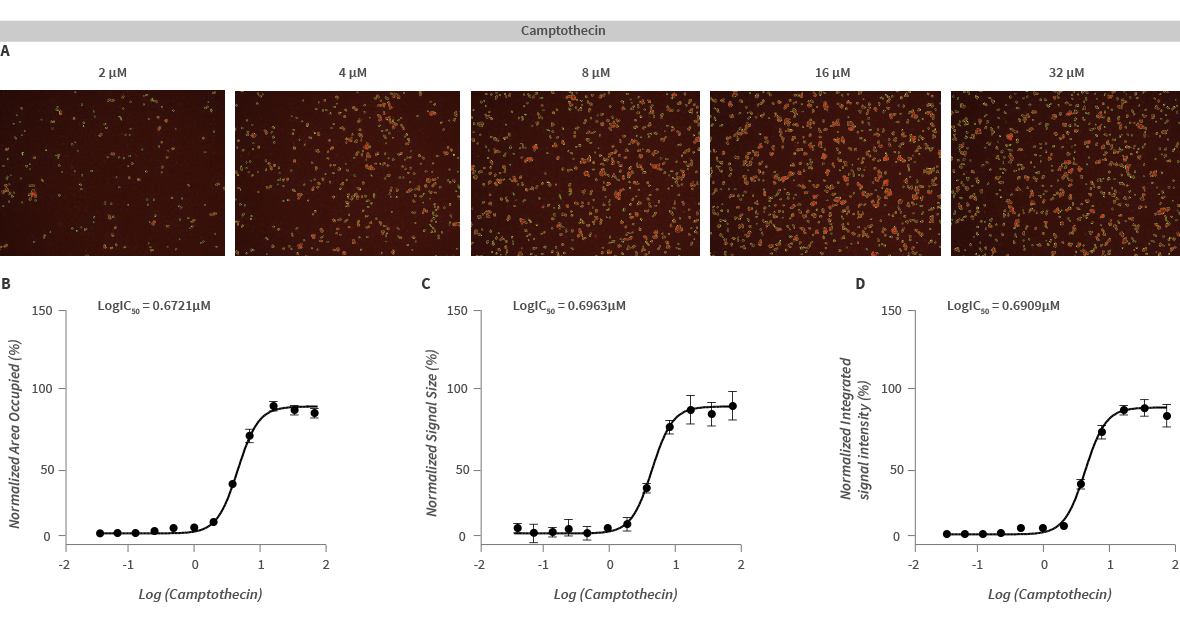
Figure 2. BPropidium iodide-stained HeLa cells after 20 hours of Camptothecin treatment. (A) Image analysis of Camptothecin-induced cytotoxicity with green borders outlining propidium iodide-stained nuclei. Dose-response curves show the cytotoxic effects of Camptothecin on (B) occupied surface area, (C) size, and (D) integrated intensity of the propidium iodide signal.
In this study, we used the CELENA® X to evaluate the dose-dependent cytotoxicity of Camptothecin in a simple, effective, and highly reproducible way. The CELENA® X allowed us perform a multi-parameter assessment on the effects of Camptothecin on cell viability. Using the CELENA® X High Content Imaging System and CELENA® X Cell Analyzer software, the same experimental conditions as well as the identical analysis pipeline can be reused to verify results.
10KB


