Keywords
Key Features
A key first step in the drug discovery process for anti-cancer treatment is understanding the relationship between a dysregulated cell cycle and the formation of abnormal, cancerous cells. Since many anti-cancer drugs are designed to specifically target DNA synthesis and/or mitosis, there are a multitude of cell cycle assays that are used to monitor and quantify the impact of these treatments have on the cell cycle process.
Here, we demonstrate how the CELENA® X High Content Imaging System and the CELENA® X Cell Analyzer software can be used for monitoring and screening the dose-dependent effects of the anti-cancer drugs thymidine and paclitaxel through the cell cycle.
Cell Cycle Assay
We utilized the CLICK-IT™ EdU Cell Proliferation Kit (Life Technologies, C10337) and a Phospho-Histone H3 (Ser10) Rabbit Polyclonal Antibody (pHH3; Life Technologies, PA5-17869) to visualize the effects of thymidine (Sigma-Aldrich, T1895) and paclitaxel (Sigma-Aldrich, T7402) treatments on HeLa Cells. EdU is a thymidine analog and marker for DNA replication. pHH3 is a marker for chromosomal condensation that occurs in mitosis. For this procedure, HeLa cells were grown, seeded in 96-well plates at a density of 1.2 X 10⁴ cells/well (LUNA-II™ Automated Cell Counter), and incubated overnight. The cells were subsequently treated with either thymidine or paclitaxel for 16 hours, as indicated in Figure. 1. Afterward, half the media was removed, replaced with a pre-warmed 2X EdU solution to bring a final concentration of 10 µM, further incubated for 3 hours, and then fixed with 4 % PFA. After fixation, the cells were treated with the Click-IT™ reaction cocktail for 30 minutes at room temperature and added with pHH3 antibody at 1:150 dilution followed by an AF 680-labeled secondary antibody (Life Technologies, A10043). The cell nuclei were counterstained with Hoechst 33342 (Life Technologies, H3570). The cells were washed with 1X PBS between each step.
Imaging and analysis
For imaging, we used the CELENA® X High Content Imaging System with an Olympus 10X LWD high NA objective, a DAPI filter cube (Ex395/25, Em460/50), an EGFP filter cube (Ex470/30, Em530/50), and a Cy5 Long Pass filter cube (EX620/60, Em665lp). Desired wells were selected and scanned using laser autofocus.
Cell cycle assessment was quantified by filtering objects without green and far-red signals from all nuclei. Objects containing blue fluorescence were identified using the ‘IdentifyPrimaryObjects’ module. The median intensity of blue, green, and far-red signals from all nuclei was measured using the ‘MeasureObjectIntensity’ module. The number of nuclei with green or far-red signals were counted using the ‘FilterObjects’ module (Table 1).
To visualize the data, the ‘GrayToColor’ module was used to produce color composite images from grayscale images (Figure 1A, B). GraphPad Prism® software (GraphPad Software, Inc.) was used to plot sigmoidal dose-response curves and calculate EC50 values.
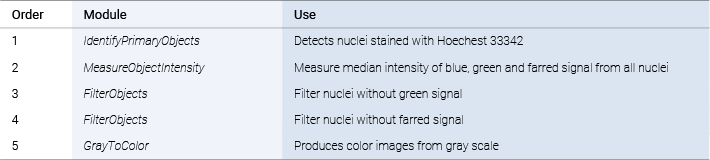
Table 1. Description of the pipeline used to assess cell cycle with CELENA® X Cell Analyzer
Both thymidine and paclitaxel act to arrest the cell cycle, but at different phases. Paclitaxel arrests the cell cycle in the M phase (mitosis) by preventing the dissociation of microtubules and halting progression from metaphase to anaphase. As expected, paclitaxel treatment decreased the EdU-positive cells, but increased the pHH3-positive cells (Figure 1A, C), indicating that paclitaxel induced the M phase arrest. By comparison, thymidine blocks DNA replication and a cell’s entry into the S phase (DNA synthesis) by interrupting deoxynucleotide metabolism through competitive inhibition. Thymidine treatment decreased both EdU-positive cells and pHH3-positive cells (Figure 1B, D), showing the G1/S phase arrest.
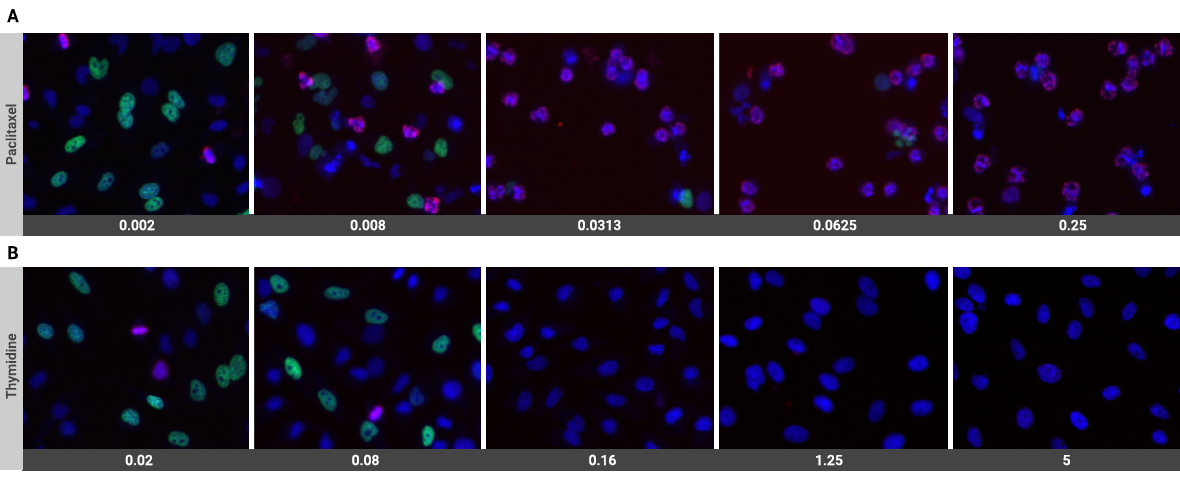

Figure 1. A montage and a chart after 16 hours of Thymidine or Paclitaxel treatment. (A and B) Color composite images showing from EdU (green), pHH3 (red) and nuclei (blue). (C and D) Dose response curves show the EdU and pHH3 positive cells after different concentrations of Thymidine or Paclitaxel treatment.
Here, we have shown how the automated CELENA® X High Content Imaging System may be used in a multivariate drug screening process. Using CELENA® X Cell Analyzer software with laser autofocus and a data analysis pipeline, the CELENA® X can provide highly efficient workflow and data-driven analysis in accelerating high throughput screening efforts. In conclusion, we showed that the CELENA® X High Content Imaging System, and the CELENA® X Cell Analyzer software is an excellent system for drug screening targeting the cell cycle.
4KB


