Keywords
One of the most significant challenges in image-based cell counting is the difficulty in accurately segmenting cell aggregates. This issue is pronounced when working with cancer cell lines like AsPC-1 (pancreatic adenocarcinoma) and H-1975 (non-small cell lung carcinoma), which naturally tend to form tight clusters during culture. Cell aggregates obscure boundaries which makes it difficult to distinguish individual cells with conventional imaging. This often leads to misclassification or undercounting, compromising viability and concentration accuracy and potentially skewing downstream applications like drug screening and therapeutic evaluation.
The LUNA-FX7™ Automated Cell Counter mitigates this challenge through its advanced imaging system and refined segmentation algorithms optimized for aggregated cells. Achieving reliable results also depends on using slide formats that minimize variability and simplify the staining workflow. While the PhotonSlide™ has served as a trusted standard for AO/PI-based viability staining, the SpectraSlide® AP-1 offers added workflow benefits with its pre-coated AO/PI surface and intuitive “click–dip–release” design, eliminating the need for manual dye handling. By combining this streamlined slide format with the advanced imaging and segmentation capabilities of the LUNA-FX7™, researchers can achieve both operational efficiency and analytical precision. This application note highlights how the SpectraSlide® AP-1, when paired with the LUNA-FX7™, delivers accurate, reproducible results even for highly aggregated cancer cell models like AsPC-1 and H-1975.
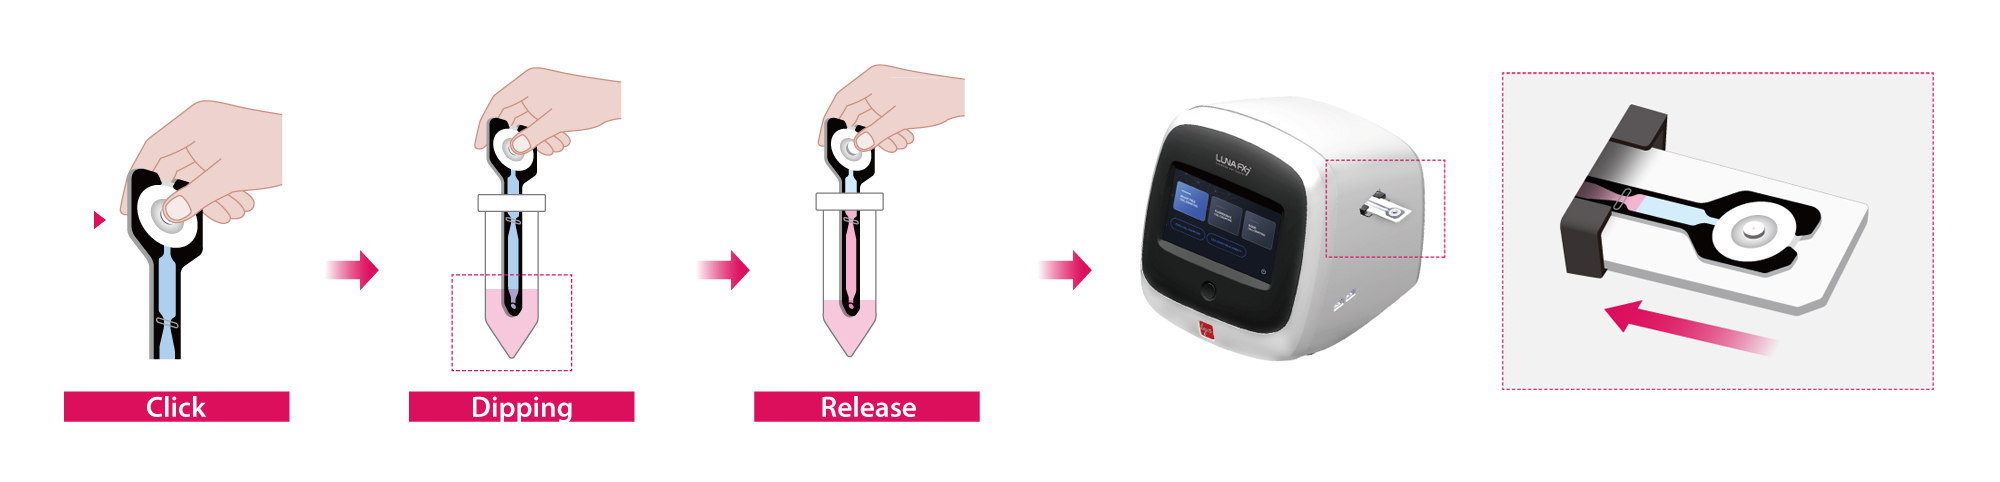
Figure 1: Illustration of the SpectraSlide® AP-1 workflow. Press the sampling button, dip the sampling hole in the sample, release to draw in the liquid, and insert the slide into the LUNA-FX7™ for automated cell counting.
AsPC-1 and H-1975 cells were cultured in RPMI-1640 medium supplemented with 10% fetal bovine serum (FBS) and 1 % penicillin-streptomycin. Cells were incubated at 37°C in a humidified atmosphere containing 5 % CO₂.
To evaluate the accuracy of cell concentration and viability measurements, live cells were mixed 1:1 with heat-inactivated cells, generating samples with approximately 50 % viability. Heat-killed cells were prepared by incubating the suspension at 100 °C for 30 minutes.
Analyses were conducted using the LUNA-FX7™ Automated Cell Counter with either the PhotonSlide™ (Cat# L12005) or the SpectraSlide® AP-1 (Cat# L72061). For the PhotonSlide™, the 2 Ch mode was selected, and 18 µL of the cell mixture was stained with Acridine Orange/Propidium Iodide (AO/PI) reagent (Cat# F23001) at a 9:1 ratio. Then, 10 µL of the stained suspension was loaded into the slide and analyzed using the default protocol. For the SpectraSlide® AP-1, the Spectra mode was selected. 500 µL of unstained cell suspension was directly loaded to the slide and analyzed using the SpectraSlide® AP-1 protocol.
To assess the performance of the LUNA-FX7™ Automated Cell Counter in analyzing highly aggregated samples, AsPC-1 and H-1975 cells were evaluated using both the PhotonSlide™ and SpectraSlide® AP-1. Representative overlay images (Figure 2A and 2B) demonstrate accurate segmentation and classification of clustered cells, with individual cells clearly identified and tagged as live (green) or dead (red), regardless of slide format.
Quantitative measurements of cell concentration and viability showed comparable performance between the two slide types. Cell concentration values were consistent between formats, averaging approximately 2.5 × 10⁶ cells/mL for AsPC-1 and 2.0 × 10⁶ cells/mL for H-1975 (Figure 2C and 2D). Viability measurements also showed close agreement, with values near target viability of 50 % for both cell lines and slide types (Figure 2E and 2F).
Figure 2. (A, B) Representative montage images of CHO-K1 (A) and (B) cells captured on the LUNA-FX7™. The left panel shows unstained brightfield images, while the right panel displays fluorescence overlays with viable cells stained green and non-viable cells stained red.
(C, D) Bar graphs comparing total cell concentrations obtained using the PhotonSlide™ and SpectraSlide® AP-1 for CHO-K1 (C) and HEK293 (D) cells.
(E, F) Viability percentages for CHO-K1 (E) and HEK293 (F) cells, showing close agreement between the two slide types.
BF: Images captured in the brightfield channel.
Tag: Composite images of all channels, fluorescent and brightfield, with identified objects marked using red and green circles. Red circles indicate dead cells, while green circles represent live cells.
This study demonstrates that the SpectraSlide® AP-1 is a reliable and efficient solution for cell counting and viability analysis in aggregation-prone cancer cell lines such as AsPC-1 and H-1975. When paired with the LUNA-FX7™ Automated Cell Counter, its advanced algorithms accurately detect and segment individual cells within dense clusters—overcoming one of the key challenges in image-based analysis. The SpectraSlide® AP-1 delivered performance comparable to the PhotonSlide™ in standard viability assays, with cell concentration and viability results closely matching between the two formats. Its AO/PI coating eliminates manual dye handling, streamlining workflows and enhancing consistency. Overall, the SpectraSlide® AP-1 broadens the applicability of automated fluorescence-based cell analysis by simplifying sample preparation while maintaining high accuracy, even under the challenging cancer cell types.


