From Data Analysis to Graphs — All in One with LUNA-FX7™
Cell culture isn’t just about keeping cells alive — it’s about making sure you have the right number of healthy cells exactly when you need them. A growth curve gives you a clear picture of how cells are proliferating over time, while growth rate and doubling time put that speed into hard numbers. Together, these indicators are essential for decisions like when to passage cells, when to apply treatments, or how to plan production schedules.
The cell counting process is essential. Accurate measurement of cell numbers is required to construct a growth curve, which in turn allows quantitative evaluation of cell proliferation rate and culture status. Traditionally, this involved sampling cells at regular intervals, manually counting them, and then calculating and plotting the curve. However, with the LUNA-FX7™, accurate cell counting is ensured, and the Bioprocess function automatically generates Growth rate, Doubling Time, and trend graphs—saving researchers valuable time and improving data reproducibility.
A cell growth curve typically follows four distinct phases:
1. Lag phase – Cells adapt to a new environment and prepare their metabolism for growth. There’s little division yet, but enzyme synthesis and gene regulation are active.
2. Log phase – With nutrients and conditions optimized, cells divide exponentially. Doubling time stays constant here, making it the most important phase for studying growth rate and physiology.
3. Stationary phase – As nutrients are depleted and waste builds up, cell division slows and balances with cell death. Metabolism shifts, and some cells switch into survival mode.
4. Death phase – Eventually, nutrient shortage and toxins cause more cells to die than divide, reducing the overall population.
To correctly identify these phases, you need precise, quantitative data. This comes from cell counting — tracking how cell numbers change over time allows you to distinguish phases, calculate doubling times, and design smarter culture strategies. With the LUNA-FX7™, cell counting is automated and processed with consistent algorithms, making your results faster, more accurate, and easier to compare across experiments or between researchers.
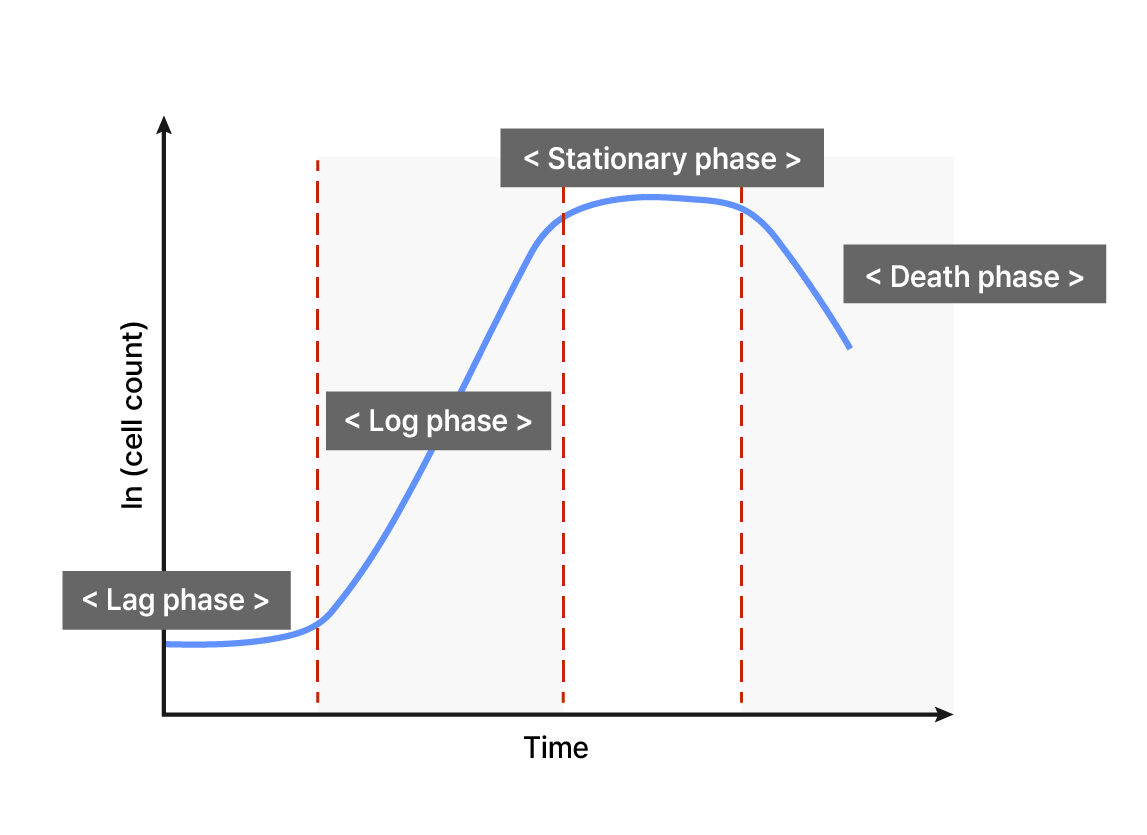
A graph showing the four typical phases of a cell growth curve (Lag, Log, Stationary, and Death).
Each phase is defined by the physiological state of the cells and the culture conditions and serves as a key indicator for calculating doubling time and designing experiments.
• Seeding density : If the initial cell number is too low, entry into the log phase will be delayed; if too high, the growth curve becomes shorter. Choose the seeding density based on the cell line’s doubling time and the purpose of the experiment.
• Measurement interval: Set intervals according to the doubling time of the cell line (typically every 12–24 hours). For fast-growing cells, use shorter intervals to capture subtle changes more effectively.
• Culture conditions: Maintain consistent temperature, CO₂ concentration, and media composition, and manage microenvironmental factors such as incubator placement, ventilation, and humidity.
• Bioprocess protocol settings: In the LUNA-FX7™ Protocol menu, create a dedicated Bioprocess protocol so repeated measurements are carried out under the same conditions. Clearly label protocol names to prevent other users from overwriting data, and switch back to another protocol after use.
• Protocol review in advance: Check channel settings, image focus range, and analysis parameters before starting the experiment to ensure reproducibility
The LUNA-FX7™ Bioprocess function tracks each batch according to the designated protocol and, based on cell counting data, automatically calculates growth rate, doubling time, and viability, displaying them as graphs. To make the most of this feature, it’s important to pay attention to a few key points beyond simply following the manual:
• Data storage condition: Before running COUNT, ensure that the “Counting chamber area” is set to “Current.” Otherwise, the Bioprocess button will not be activated.
• Protocol consistency: Always use the same protocol when collecting data from the same batch of cells. Switching protocols midway will cause data to be stored separately, making comparison difficult.
• Data export: Export CSV files and graphs via USB to perform custom analyses in Excel or statistical software, in addition to the internal analysis tool.
• Graph customization: Within the instrument’s graph viewer, you can change the Y-axis to “total cell count / live cell count / viability,” and adjust the X-axis to “day/month/year” for alternative perspectives.
• Data management: After experiments, delete only unnecessary previous Bioprocess data but keep the protocols for reuse in future experiments under the same conditions.
With the [EXPORT] function, you can extract CSV files and the graphs displayed on the instrument screen. At the bottom of the CSV file, the measurement times and corresponding results are recorded. These datasets can be processed to extract only the information you need or to create custom graphs. For example, applying a log transformation to the total cell concentration makes the log phase more visible, which greatly improves growth rate analysis based on cell counting data.
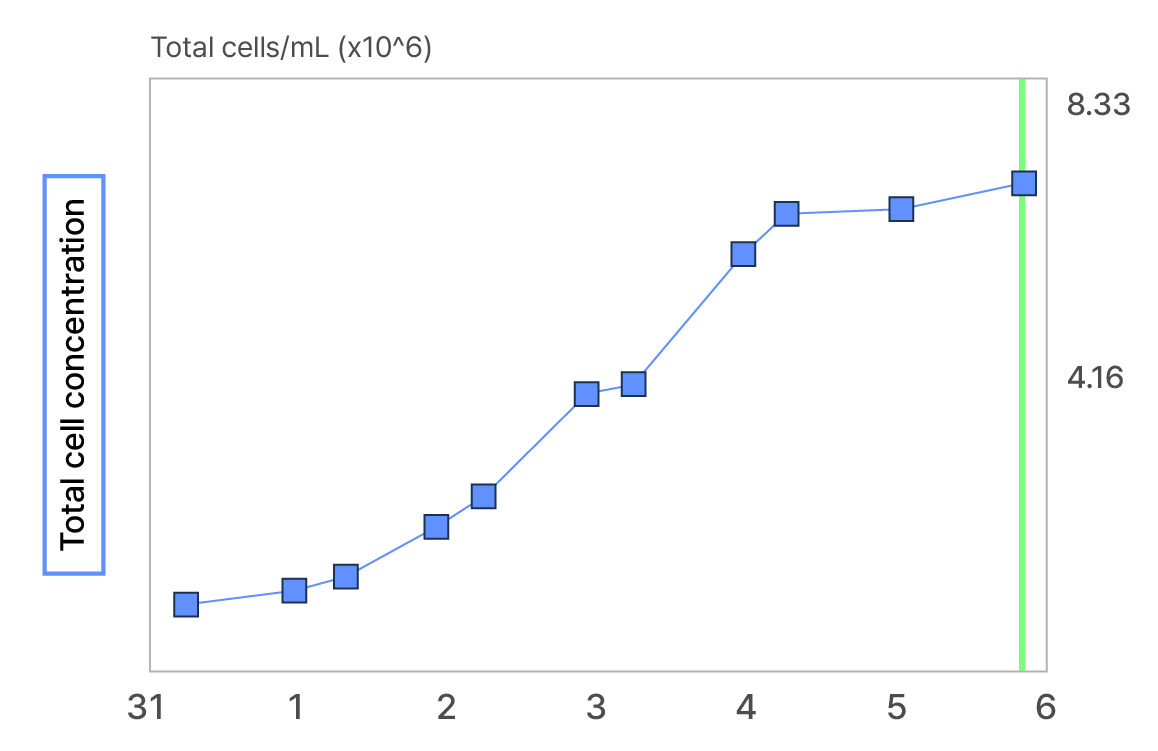
Example of a graph exported via Bioprocess [EXPORT] – The X-axis represents days, and the Y-axis represents total cell concentration, visually illustrating the trend of cell proliferation over the culture period.
Two of the most representative metrics used to quantify cell growth speed are growth rate and doubling time. Both values are fundamentally calculated from cell counting data.
Growth rate formula:

Multiply by 100 to express results as %/hour.
Doubling time formula:

Doubling time is generally calculated based on the most recent previous result. This is because the growth rate is not constant, and calculating the doubling time for each interval separately allows changes to be observed more clearly.
Growth rate ↔ Doubling time conversion:

Where:
N1 = cell number (or concentration) at time t1
N2 = cell number (or concentration) at time t2
t2 – t1 = time interval (hours)
This relationship allows you to calculate one value if the other is known. Traditionally, this requires repeated manual cell counting, but with Bioprocess the calculations are performed automatically, preventing errors and saving time. Since every data point is processed with the same algorithm and parameters, results become more reliable across researchers and repeated experiments.
• Increase in Doubling Time
→ A signal that cell health may be declining. With the LUNA-FX7™ Bioprocess, you can automatically track changes in Doubling Time and quickly check if culture medium replacement, nutrient supply, or stability of temperature and pH need attention.
• Decrease in Growth Rate
→ Indicates slower cell proliferation. The precise cell counting data from LUNA-FX7™ helps you identify possible causes—such as nutrient limitations or stress specific to your cell line—and adjust culture conditions accordingly.
• Batch-to-Batch Growth Rate Comparison
→ Consistent and repeated cell counting results from LUNA-FX7™ allow you to quantify differences between batches. This makes it easier to optimize production or experimental schedules and build more reliable production plans.
• Drug Treatment Timing
→ To maximize effectiveness, drugs should be applied during the log phase. With the Bioprocess growth curve, you can monitor log phase entry in real time and choose the exact right timing.
• Quality control(QC) & Long-Term Monitoring
→ The LUNA-FX7™ Bioprocess automatically calculates elapsed time from the first measurement, making it easy to track quality changes and detect early warning signs in long-term cultures or continuous production processes.
The cell growth curve, growth rate, and doubling time can be thought of as a “health check-up” for cell culture. And all of these metrics ultimately begin with accurate cell counting — without reliable counts, proper analysis and interpretation are impossible.
By using the LUNA-FX7™ Bioprocess function, this process becomes easier, faster, and more accurate, enabling truly data-driven experimental design. If you want to improve research efficiency and reproducibility, make full use of the Bioprocess function.
For detailed experimental examples and additional tips, refer to the application note:
Application Note: Bioprocess analysis with the LUNA-FX7™
Q1. Why is my doubling time increasing across different time points?
A. A consistent increase in doubling time often indicates a decline in cell health or stress in the culture environment. This may result from nutrient depletion, pH fluctuations, or the accumulation of metabolic byproducts. If the trend persists, review media replacement schedules, nutrient availability, and incubator stability (temperature and CO₂).
Q2. How often should I measure cells to build an accurate growth curve?
A. For most mammalian cells, measuring every 12–24 hours provides reliable data. For fast-growing cell lines, shorter intervals may be necessary to capture rapid changes, particularly during the log phase.
Q3. How can I tell if my cells are in the log phase without waiting for the full curve?
A. Signs of the log phase include stable doubling times, healthy morphology, and steadily increasing cell density. Automated systems like the LUNA-FX7™ allow real-time monitoring, making it easier to confirm log phase entry without completing the entire growth curve.
Looking for the Korean version? Click here.
Logos Biosystems provides a diverse portfolio of automated cell counters designed to meet various laboratory requirements.
To learn more, visit www.logosbio.com.


