A Complete Guide to Cell Culture Confluence : From Accurate Measurement to Improved Experimental Reproducibility
2026-02-06
A Complete Guide to Cell Culture Confluence : From Accurate Measurement to Improved Experimental Reproducibility
1. Why Is Confluence Important?
In cell culture experiments, decisions such as “When should I passage the cells?” or “Is it appropriate to proceed with transfection at the current state?” are made repeatedly. One of the most practical criteria for these decisions is confluence. Confluence is not merely a qualitative indicator of “more cells vs. fewer cells”; it is a key variable that can influence cell physiology and the variability (reproducibility) of experimental outcomes.
Even with the same cell line and culture conditions, differences in confluence can lead to changes in a wide range of biological readouts, including proliferation rate, gene expression, and drug responsiveness. In particular, experiments that are sensitive to cell state—such as transfection, differentiation induction, and drug screening—benefit substantially from accurate management and documentation of confluence, as it directly affects experimental success and data interpretation.
2. What Is Confluence?
Confluence is defined as the percentage (%) of the culture surface area (e.g., flask, dish, or well) that is covered by adherent cells. For example, 70 % confluence means that approximately 70 % of the culture surface is occupied by cells, while the remaining 30 % remains uncovered.
Confluence vs. Cell Density: Two Easily Confused Concepts
Although confluence is often used interchangeably with cell density, these two parameters represent different concepts:
Cell density: number of cells per unit area (cells/cm²)
Confluence: proportion of surface area covered by cells (%)
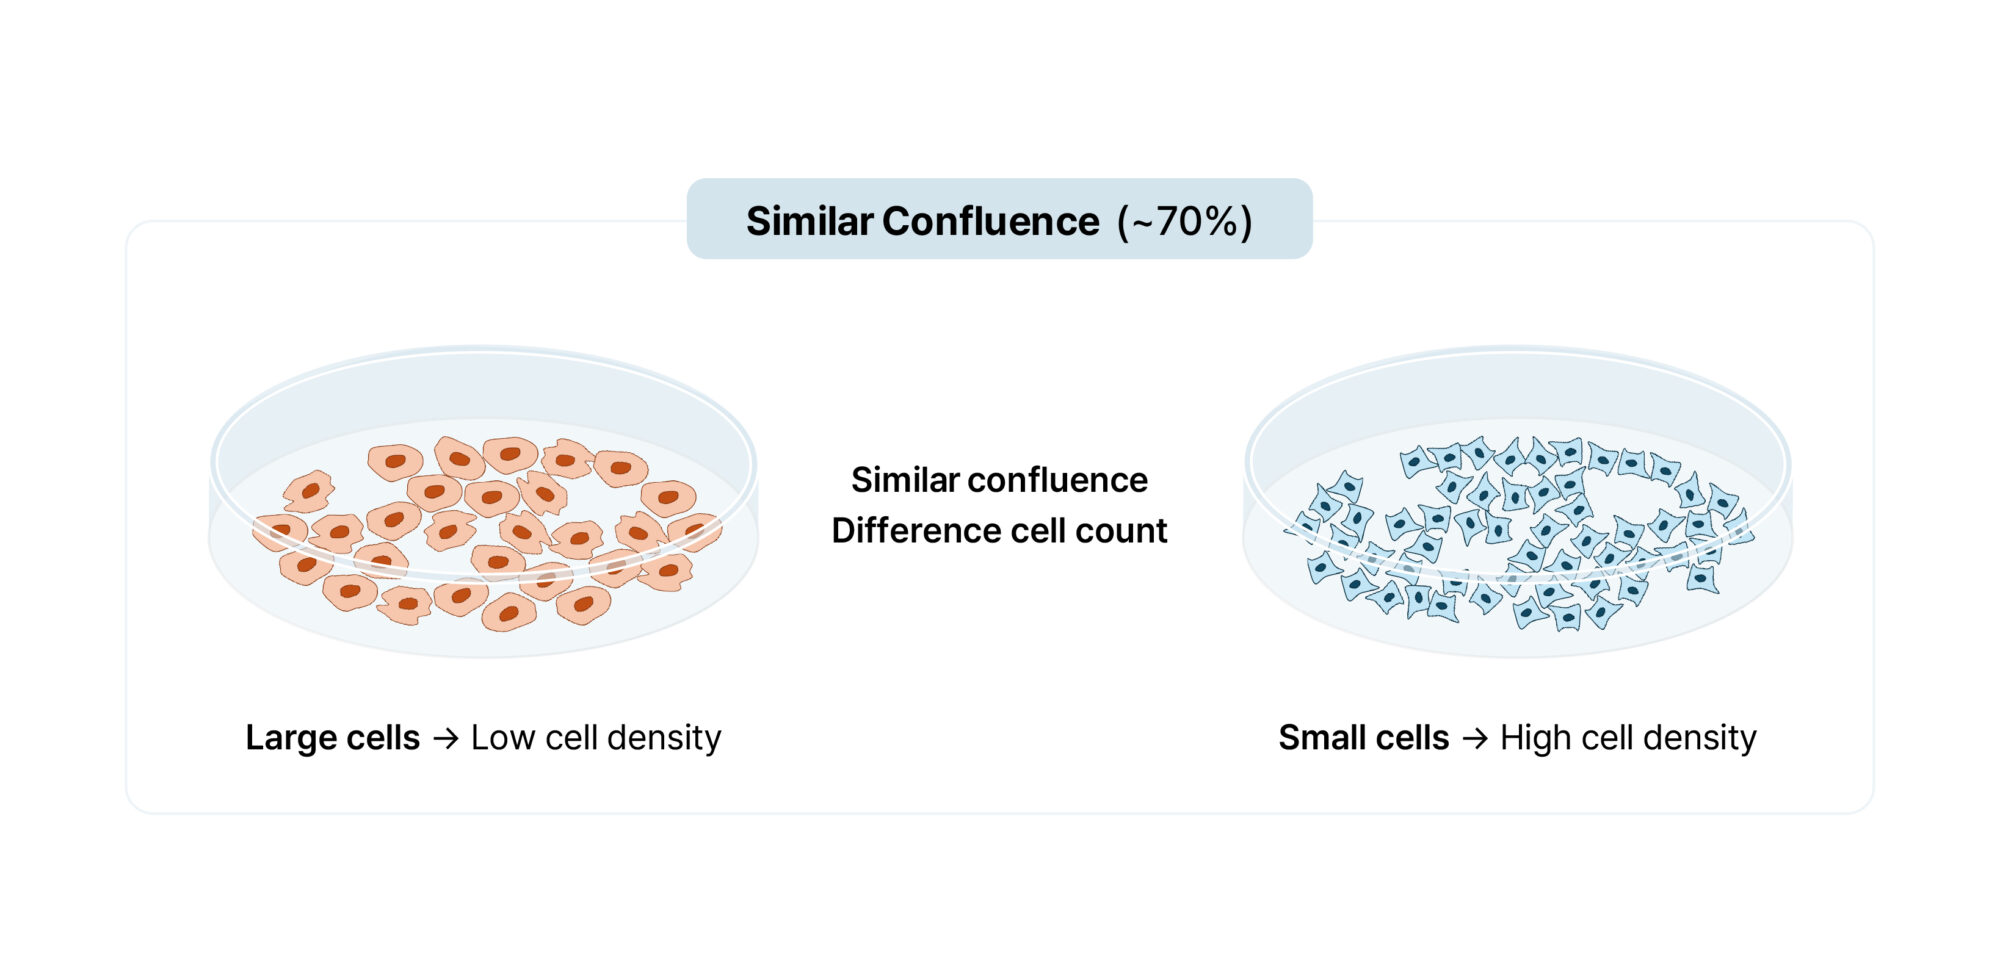
Even at the same 70 % confluence, the actual number of cells can vary considerably depending on cell size and morphology. Therefore, when designing experiments and interpreting results, it is important to distinguish confluence from cell density.
Figure 1. Difference Between Confluence and Cell Density Even at a similar confluence (~ 70 %), cell density can differ substantially depending on cell size. Larger, more spread cells typically show a lower cell density, whereas smaller cells require a higher number to cover the same surface area and thus exhibit a higher cell density.
3. Cell Characteristics at Different Confluence Levels (Experimental Perspective)
1 ) 30 – 50 % : Active Proliferation Phase (Log Phase) In this range, cells generally have sufficient space and nutrients and tend to proliferate actively. Cell–cell contact is limited, and responsiveness to external stimuli (e.g., growth factors or treatment conditions) can be relatively high.
Key characteristics
Rapid proliferation and high metabolic activity
Minimal cell–cell contact
Higher sensitivity to stimulation
Typical applications
Measurement of growth curves
Comparison of proliferation rates
Initial seeding stage for long-term culture
2 ) 70 – 80 % : A Commonly Recommended Experimental Window In many cell-based experiments, 70–80% confluence is frequently recommended because cells maintain a relatively stable state without becoming overcrowded, making it easier to standardize experimental conditions (note that the optimal window may vary depending on the cell line and protocol).
Key characteristics
Relatively stable metabolic state
Uniform morphology
Appropriate cell–cell interaction
Suitable for standardization
Typical applications
Transfection (often referenced around 70 – 80 %)
Protein extraction / Western blot
Drug treatment and dose–response assays
Differentiation induction and gene expression analysis
3 ) 90 – 100 % : Over-Confluence and Potential Contact Inhibition When the culture surface is almost fully covered, normal cells may exhibit contact inhibition, leading to reduced or halted proliferation. In addition, limitations in nutrients and oxygen, as well as accumulation of metabolic byproducts, may increase cellular stress.
Key characteristics
Proliferation may slow or stop
Potential nutrient/oxygen depletion
Increased stress; possible medium pH changes
Possible morphological changes
Considerations
Prolonged maintenance may increase cell death
Unintended differentiation may occur
Experimental variability may increase
When it may be used (exception cases)
Contact inhibition–related studies
Specific differentiation protocols
Starting conditions for scratch (wound-healing) assays
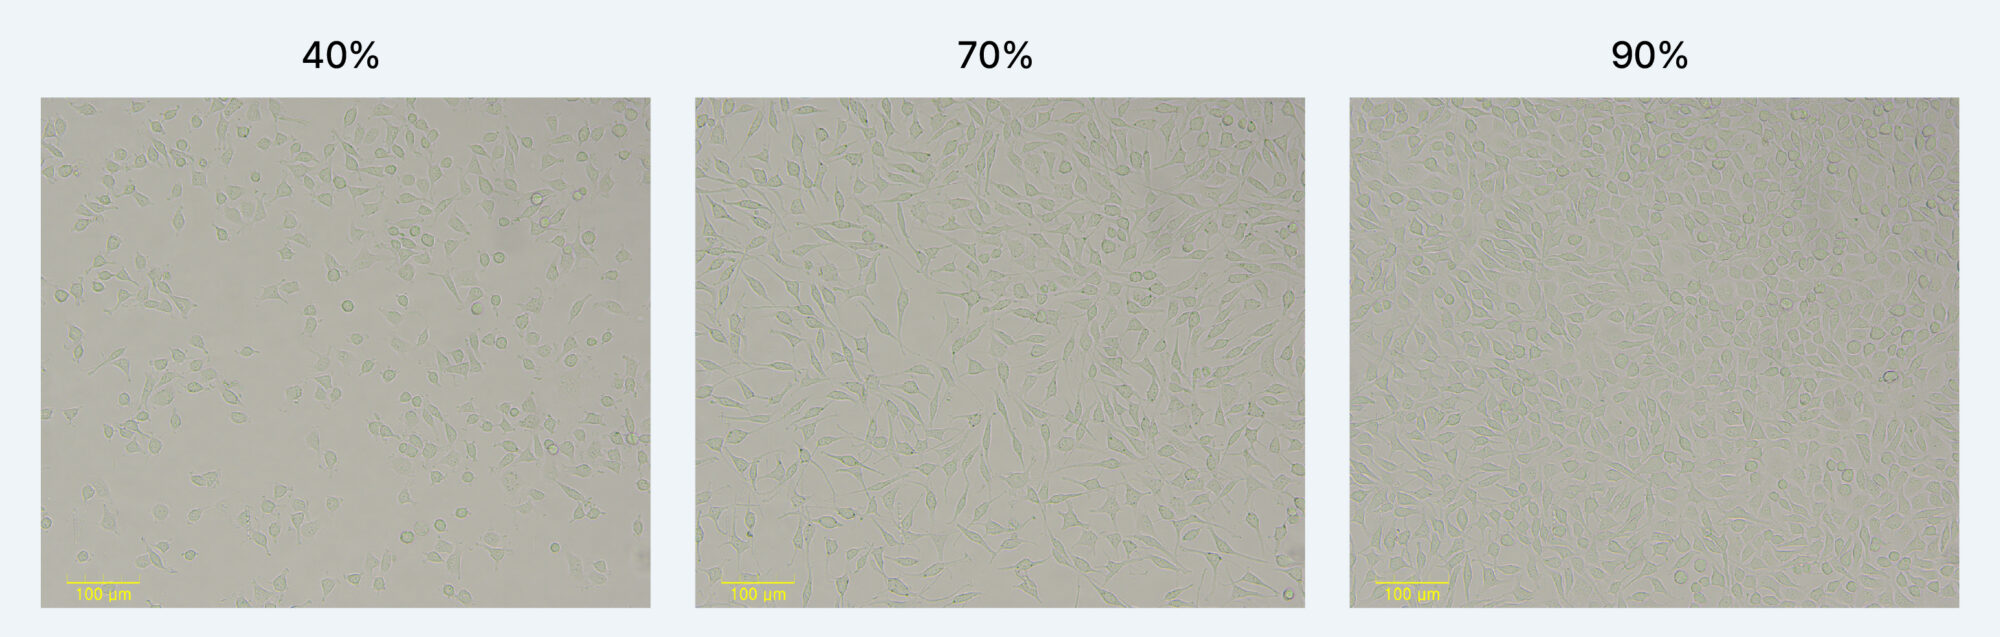
Figure 2. Representative Cell Culture Images at Different Confluence Levels (e.g., 40 %, 70 %, 90 %) Brightfield images (10×) of McCoy cells cultured at 40 %, 70 %, and 90 % confluence. As confluence increases, cell–cell contact becomes more frequent and uncovered areas decrease.
4. Methods for Measuring Confluence: From Subjective Estimation to Quantification
1 ) Limitations of Visual Estimation Traditionally, confluence has often been estimated based on microscope observation and experience. However, subjective estimation has clear limitations:
Key characteristics
Different criteria among researchers
Variability within the same researcher over time
Reduced accuracy when cell distribution is non-uniform
Difficulty in generating quantitative records, limiting reproducibility
2 ) Estimation Based on Manual Counting (with Limitations) Some laboratories estimate confluence by measuring cell number using a hemocytometer or an automated cell counter and relating it to vessel surface area. However, this approach requires detachment, making real-time monitoring difficult. In addition, changes in cell size and morphology may not be adequately reflected.
3) Confluence Measurement Using Automated Cell Imaging To overcome these limitations, image-based (automated cell imaging) confluence measurement is increasingly adopted. This approach repeatedly acquires images without disturbing the culture and identifies cell-covered regions (coverage) using consistent criteria, enabling confluence calculation as an area percentage.
Advantages of image-based confluence measurement
Objective measurement : reduces user-to-user variability and enables data-driven comparison
Non-destructive longitudinal monitoring : tracks the same sample over time without detachment
Evaluation of culture uniformity : identifies locally over-confluent or sparse regions across the vessel/well
For example, cell imaging systems such as CELENA® X can acquire brightfield images (Explorer) and calculate confluence using analysis pipelines (Analyzer). Analysis parameters can be adjusted depending on cell characteristics and imaging conditions.
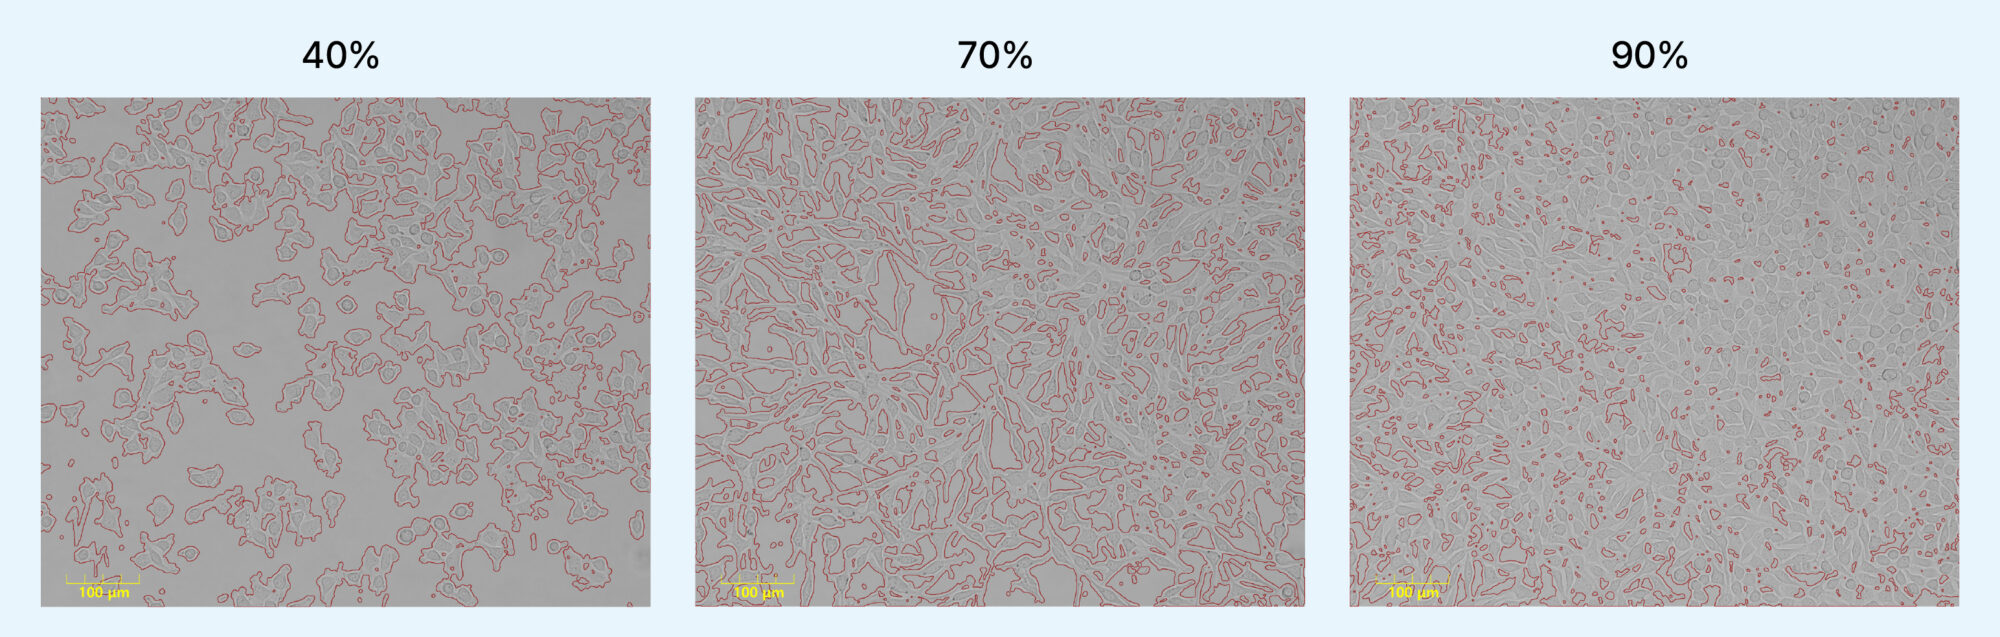
Figure 3. Example of Confluence Analysis (Detection of Cell-Covered Regions) An image analysis pipeline applied to the same brightfield images in Figure 2 highlights cell-detected regions in red (contours). Confluence can be calculated based on the surface area of detected coverage, and parameters can be tuned according to morphology and imaging conditions.
5. How Confluence Affects Experimental Outcomes (Common Examples)
1 ) Transfection Efficiency Transfection is known to be sensitive to confluence, and many protocols commonly recommend ~70–80% confluence. In general (depending on the cell line, reagent, and protocol):
Key characteristics
Low confluence (< 50 %) : efficiency may vary due to insufficient cell number and/or increased stress
Appropriate range (e.g., 70 – 80 %) : balance between cell health and performance
High confluence ( >90 %) : uptake may decrease due to increased cell–cell contact
2 ) Cell Differentiation Differentiation of stem/progenitor cells can be influenced by confluence and cell–cell contact. Some protocols leverage higher confluence where contact inhibition–related signaling may promote differentiation, or require specific confluence levels to support processes such as cell fusion.
3 ) Drug Response Confluence can also affect drug response (e.g., sensitivity and IC₅₀). For example, antiproliferative agents may show increased sensitivity at lower confluence, and cytotoxic response curves may shift with confluence. Therefore, controlling and documenting confluence is important in screening and dose–response experiments.
6. Practical Tips to Maintain Optimal Confluence (Standardization Perspective)
① Regular observation and documentation
Check culture status at consistent time points
Accumulate imaging-based confluence data to build internal reference criteria
② Standardize culture conditions
Maintain consistent seeding density
Standardize medium change intervals
Stabilize temperature/CO₂ and other environmental factors
③ Reflect cell-line characteristics
Fast-growing cell lines: increase monitoring frequency
Primary cells: manage cultures with sufficient buffer time
④ Specify confluence in protocols
Record target confluence ranges to improve reproducibility
Clearly describe confluence conditions in Methods sections
⑤ Consider passaging before over-confluence
Many workflows recommend passaging before reaching ~80–90%, with adjustments based on the cell line and experimental goal
7. Conclusion
Confluence is not merely a number—it is a key indicator reflecting cellular physiological state. Accurate measurement and control of confluence provide an important foundation for improved experimental reproducibility.
Image-based confluence measurement complements the limitations of subjective estimation and helps manage culture status using consistent criteria. For confluence analysis workflows using CELENA® X and related application examples, please refer to Logos Biosystems application notes.
Logos Biosystems provides a diverse portfolio of automated cell counters designed to meet various laboratory requirements. To learn more, visit www.logosbio.com.